
In today’s data-driven world, statistics has become an indispensable tool for understanding patterns, making decisions, and solving problems across various domains. From analyzing trends in business and economics to interpreting scientific experiments and shaping public policies, statistics provides the framework for making sense of complex datasets. In this article, we will explore the fundamentals of statistics, its importance, and its applications.
What is Statistics?
The term “statistics” has evolved from its initial focus on statecraft and data about the state to encompass the broader collection, analysis, and interpretation of numerical data of any kind. Initially, “statistics” referred to the collection of data about the state, such as population size, military information, and economic resources, with the term often associated with the “science of state”. Over time, the meaning expanded to include the analysis and interpretation of data from various fields, eventually becoming the modern discipline of statistics.
Statistics is the branch of mathematics that deals with collecting, organizing, analyzing, interpreting, and presenting data. It provides techniques to summarize large datasets and draw meaningful conclusions. Its relevance cuts across various fields of making people and institutions to make decisions. Statistics is the basis for making decisions. It is useful in forecasting, decision on risks, and detection of patterns in a lot of situations. Statistics is used to transform raw data to knowledge that can be applied.
Statistical history
The term “statistics” originally referred to information about states, particularly demographics and economic data used for governance and administration. The 18th and 19th centuries saw the development of probability theory, which provided a theoretical foundation for statistical analysis. Statistics have its roots in the ancient census that were carried out by monarchs for the purpose of resource management and taxation. The term “statistics” is derived from Latin (“status”), Italian (“statista”), and German (“Statistik”), all of which relate to the concept of a political state. The Latin phrase “ratio status” which means “study of practical politics” or “the statesman’s art,” is where the word statistics originated. Achenwall coined the term “statistik” which was first used in German in the middle of the 18th century and meant “science of states” or “political arithmetic,” further solidifying the link between data collection and state management. Statistics evolved from “statistic” and is now defined as a factual and numerical assessment of a state’s current state.
Broadly, statistics can be divided into two main types:
Descriptive Statistics: Focuses on summarizing and presenting data in a meaningful way using measures such as mean, median, standard deviation, and graphical representations like histograms and pie charts.
Example: Calculating average performance scores, attendance rates, and employee turnover rates and average expenses.
Inferential Statistics: Involves making predictions or inferences about a population based on a sample. Beyond summarizing data, inferential statistics also uses a sample in making predictions or generalizing to a population. Here, methods such as regression analysis, confidence intervals, and hypothesis testing are used in order to extrapolate sample patterns to the larger population.
Example: The attendance rate of mid-level employees is taken into consideration to make conclusions about the attendance of all employees, including those at the top level, mid-level, and low-level.
Difference between Descriptive Statistics and Inferential statistics
Descriptive Statistics deals with summarising current facts into a concise statement of the state of affairs. It doesn’t try to go beyond the information available.
Inferential Statistics helps make predictions and draw inferences based on the sample data regarding a larger population or future events. They help solve questions that lie beyond what’s obvious at face value.
Why is Statistics Important?
Statistics plays a vital role in almost every field. Here are some key reasons why it is essential:
- Decision Making: Organizations use statistical methods to make informed decisions based on data analysis rather than intuition or guesswork.
- Understanding Variability: Statistics helps us understand the variability in data, identifying trends and patterns that might not be apparent.
- Problem Solving: It provides a structured approach to solving real-world problems by analyzing data and identifying root causes.
- Prediction and Forecasting: Statistical models are used to predict future trends in areas like sales, weather, and stock markets.
- Quality Control: In manufacturing, statistics is used to ensure products meet quality standards.
Key Concepts in Statistics
1. Population and Sample
- Population: The entire group of individuals or items of interest.
- Sample: A subset of the population used for analysis. Sampling is done to save time and resources while ensuring that the sample represents the population accurately.
2. Data Types
- Quantitative Data: Numerical data that can be measured (e.g., height, weight, income).
- Discrete: Countable data (e.g., number of students).
- Continuous: Measurable data (e.g., temperature).
- Qualitative Data: Non-numerical data that describes categories or attributes (e.g., gender, color).
3. Variables
- Independent Variable: The variable that is manipulated or controlled.
- Dependent Variable: The variable that is measured or observed.
4. Levels of Measurement
- Nominal: Categories without any order (e.g., colors, names).
- Ordinal: Categories with a meaningful order (e.g., rankings).
- Interval: Numerical data with equal intervals but no true zero (e.g., temperature in Celsius).
- Ratio: Numerical data with a true zero point (e.g., height, weight).
Statistical Methods and Tools
1. Data Collection
The first step in any statistical analysis is collecting data. This can be done through surveys, experiments, observations, or secondary data sources.
2. Data Analysis
Once data is collected, statistical methods are applied to analyze it:
- Descriptive Statistics: Summarize data using measures like mean, median, and mode.
- Inferential Statistics: Generalize findings from a sample to the population using techniques like hypothesis testing and regression.
3. Data Visualization
Presenting data visually makes it easier to understand and interpret. Common visualization tools include:
- Bar charts
- Histograms
- Scatter plots
- Box plots
4. Statistical Software
Modern statistical analysis often involves software tools like:
- Microsoft Excel
- R
- Python (libraries like NumPy, pandas, and Matplotlib)
- SPSS
- SAS
Applications of Statistics
1. Business and Economics
- Analyzing market trends
- Forecasting sales
- Optimizing supply chains
2. Healthcare
- Clinical trials
- Epidemiology
- Patient satisfaction analysis
3. Education
- Evaluating student performance
- Designing effective curriculums
4. Sports
- Player performance analysis
- Team strategy development
5. Public Policy
- Population studies
- Policy impact assessment
Common Misconceptions About Statistics
- Statistics Always Provides Certainty: Statistics deals with probabilities, not certainties. Conclusions drawn from data are subject to variability.
- Correlation Implies Causation: Just because two variables are correlated does not mean one causes the other.
- Bigger Samples Are Always Better: While larger samples reduce sampling error, they can still be biased if not collected properly.
Some of the Statistical Tests
Statistics is the cornerstone of data analysis and decision-making. Whether you’re a business leader, researcher, or student, understanding the basics of statistics equips you with the tools to interpret data effectively and make informed decisions. By embracing statistical thinking, you can unlock the power of data to solve problems, identify opportunities, and drive innovation.
Test of significance
- Test of significance is a formal procedure for comparing observed data with a claim whose truth we want to assess.
- Test of significance is used to test a claim about an unknown population parameter.
- A significance test uses data to evaluate a hypothesis by comparing sample point estimates of parameters to values
- If the hypothesis were true, we will get the result we expected.
Parametric Tests
A statistical test, in which specific assumption are made about the population parameter is known as parametric tests.
Examples- Students t-test (one sample, two sample, and paired), Z Test, ANOVA F-Test, Pearsons Correlation(r).
Non-parametric tests
A statistical test used in the case of non-metric independent variables, is called non-parametric test.
Examples- Sign test (for paired data), Wilcoxon Singed-Rank test(for unpaired data), Chi-square test, Spearman’s Rank Correlation (p), ANOCOVA, Kruskal-Wallis test.
Types of T- test
- One-sample T-test
- Compares the sample mean to a known value (usually a population mean )
- Used to determine if the sample comes from a population with a specific mean.
- Two-sample T-test(Independent T-test)
- Compares the means of two independent samples.
- Used to determine if there is a significant difference between the means of two groups.
- Paired sample T-test
- Compares means from the same group at different times (e.g., before and after a treatment) or from matched pairs.
- Used to determine if there is a significant difference between paired observations.
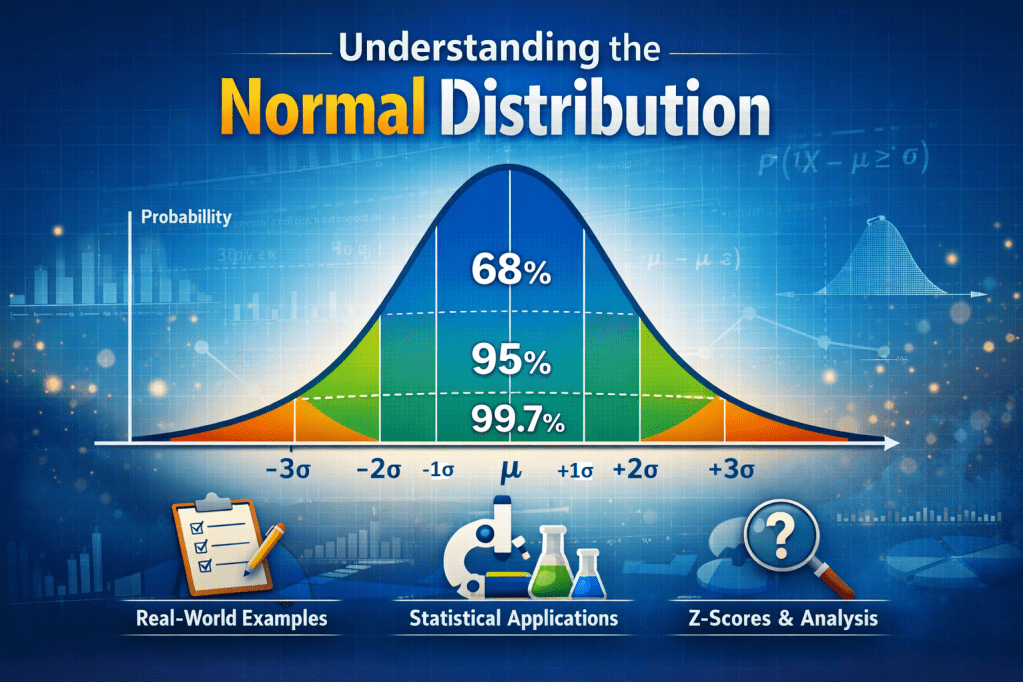
Z-Test
Used for large quantitative data (i.e. n> 30).
Application: To find out Standard Error of difference between two samples means. i.e. S.E.(X1-X2).
Types of Z-Test
- One-Sample Z-Test
- Compares the sample mean to a known population mean.
- Used to determine if the sample comes from a population with a specific mean.
- Two-Sample Z-Test
- Compares the means of two independent samples.
- Used to determine if there is a significant difference between the two sample means.
Probability of Statistics
An Insight on Probability
One of the primary aspects of Statistics is probability which is the extent of possibility of occurrence of an event. It calculates all form of unsurety and helps often in making choices for and in different areas such as economics, management, engineering and many other fields of science. In no particular order, mathematically speaking, probability is the total number of successful trials divided by the total number of trials that can be made in a random experiment. For example, in rolling a die, if one particularly wants to find the probability of a certain number, the success will be one to the number of sides of the die.
Important Aspects of Probability
1. Probability range
impossible and one estimates the event as certain. For any event one may refer to the probability estimation as and the following condition holds. Probabilities extend from zero to one inclusively, where zero probability estimates an event as
2. Events which are certain and which cannot occur
A certain event has a probability of 1, while an impossible event has a probability of 0.
3. Alternate Events
Two events, for example, and cannot occur at the same time, such events are termed as alternate events. For such events, the probability of occurrence of atleast one event is the sum of the probabilities of the events:
P(A ∪ B) = P(A) + P(B)
4. Opposite Events
The event ‘not A’ is the complement of event A defined as event A does not occur. Hence, the probabilities of an event and its opposite come to the total number 1:
P(A) + P(A’) = 1
5. Rules of Addition and Multiplication
The addition rule applies when we wish to compute the probability of the occurrence of at least one of the two events. For events which cannot occur simultaneously, the probability is equal to the sum of the probabilities of the individual events. If the events are not mutually exclusive, the relation is adjusted to:
P(A ∪ B) = P(A) + P(B) – P(A ∩ B)
P(A ∩ B) = P(A) \P(B)
Conclusion
Statistics is the cornerstone of data analysis and decision-making. Whether you’re a business leader, researcher, or student, understanding the basics of statistics equips you with the tools to interpret data effectively and make informed decisions. By embracing statistical thinking, you can unlock the power of data to solve problems, identify opportunities, and drive innovation.
Statistics is such a great tool for organizations and individuals to understand the data. Whether summarizing past trends or making predictions for the future, statistical methods give a foundation for decision-making in different sectors, especially management. Statistics Plays a vital asset in Management. It Supports data-driven decision that drive strategic growth.
By leveraging both descriptive and inferential statistics, organizations can gain valuable insights into their operations and market trends. We are able not only to describe present data but also to forecast and prepare for future developments-thus rendering statistics an essential component of modern problem-solving and strategy-building.


Leave a comment