
Statistics is the study of the collection, analysis, interpretation, presentation, and organization of data. Statistics is further divided into two major sections: Descriptive Statistics and Inferential Statistics. Summary measures in statistics, also known as descriptive statistics, provide a way to summarize and describe the key features of a dataset. They help transform complex datasets into digestible insights, making it easier to understand trends, patterns, and variability within the data. Summary measures can broadly be categorized into three main types: measures of central tendency, measures of dispersion, and measures of shape.
Under Measure of Central Tendency we have Mean, Median and Mode. Similarly Under Measure of Dispersion, we have Standard Deviation, Variance, Range, and Inter-quartile Range. Similarly Skewness and Kurtosis Comes under Shape. Central tendency is very useful in many areas like in Research, Business, etc. Let’s explore these in detail.
1. Measures of Central Tendency
Measures of central tendency describe the center or typical value of a dataset. They are used to identify a single value that represents the entire distribution.
a. Mean
- Definition: The arithmetic average of all the values in a dataset.
- Formula: Mean = (sum of the terms) / (number of terms)
- Strengths: Simple to calculate; useful for datasets without extreme values.
- Limitations: Sensitive to outliers.
b. Median
- Definition: The middle value of a dataset when arranged in ascending order.
- Strengths: Robust to outliers; represents the 50th percentile.
- Limitations: Does not consider the magnitude of values.
c. Mode
- Definition: The most frequently occurring value in a dataset.
- Strengths: Useful for categorical data.
- Limitations: May not be unique or meaningful for datasets with uniform distributions.
2. Measures of Dispersion
Measures of dispersion indicate the spread or variability of data points around the central value. They help understand the degree of consistency or diversity in the dataset.
a. Range
- Definition: The difference between the maximum and minimum values.
- Formula: Range = Max(X) – Min(X)
- Strengths: Easy to compute.
- Limitations: Highly sensitive to outliers.
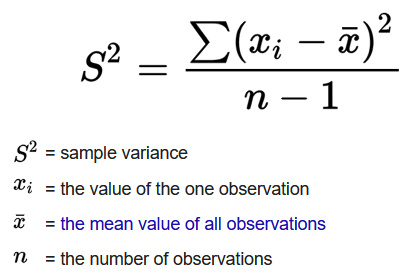
b. Variance
- Definition: The average squared deviation from the mean.
- Formula: Variance =
- Strengths: Accounts for all data points.
- Limitations: Measured in squared units, which may not be intuitive.
c. Standard Deviation
- Definition: The square root of the variance.
- Formula: Standard Deviation (SD) =
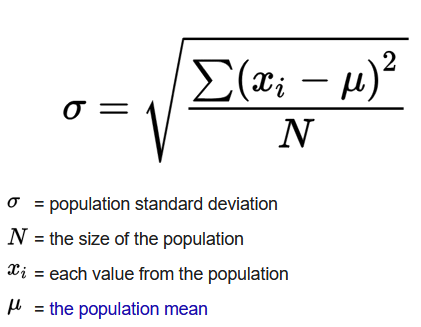
- Strengths: Expressed in the same units as the data; widely used.
Variance and standard deviation are two fundamental notions in statistics that give an account of how dispersed or spread apart data points in a dataset actually are. They tell one about how much the individual data points deviate from the central location of the dataset.
Variation is a quantity that measures the degree of spread in a dataset. It calculates through the average of the squared differences of each data point from the mean, which eliminates cancellation effect due to negative differences canceling out positive ones.
Standard deviation is actually the square root of variance and provides dispersion with the same units as the original data, hence easier to interpret.
Coefficient of Variation is a standardized measure of dispersion that expresses the ratio of the standard deviation to the mean. This is often applied when trying to compare the relative variability of different data sets, particularly where the means are decidedly different.
d. Percentiles, quartiles, and deciles are statistical measures that help divide a dataset into specific segments.
Percentiles: Percentiles divide a dataset into 100 equal parts.
Quartiles: Quartiles are specific percentiles that divide a dataset into four equal parts.
Deciles: Deciles divide a dataset into 10 equal parts
e. Interquartile Range (IQR)
- Definition: The range of the middle 50% of the data.
- Formula: IQR = Q3−Q1 , where Q1 and Q3 are the first and third quartiles, respectively.
- Strengths: Robust to outliers.
- Limitations: Ignores extreme values.
Interquartile Range is the measure of dispersion in statistics. It shows by how much the middle 50% of the data lie. And the difference between the third quartile and first quartile makes it.
3. Measures of Shape
These measures describe the distribution’s symmetry, peakedness, or tail behavior.
a. Skewness
- Definition: Indicates the asymmetry of a distribution.
- Positive Skew: Longer tail on the right.
- Negative Skew: Longer tail on the left.
- Formula: Skewness =
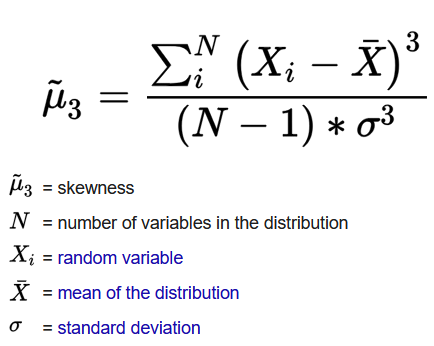
- Strengths: Highlights asymmetry.
- Limitations: Can be difficult to interpret for small datasets.
The extent to which a probability distribution is asymmetric is known as skewness. Measure of Skewness utilizes the mean, median, and standard deviation Distributions can be right-skewed (positive and on the right) or left-skewed (negative and on the left). A normal distribution displays zero skewness.
Positive Skew (Right-Skewed): The mean is pulled to the right because of a long tail on the right.
Negative Skew (Left-Skewed): A long tail at the left end pulls the mean to the left.
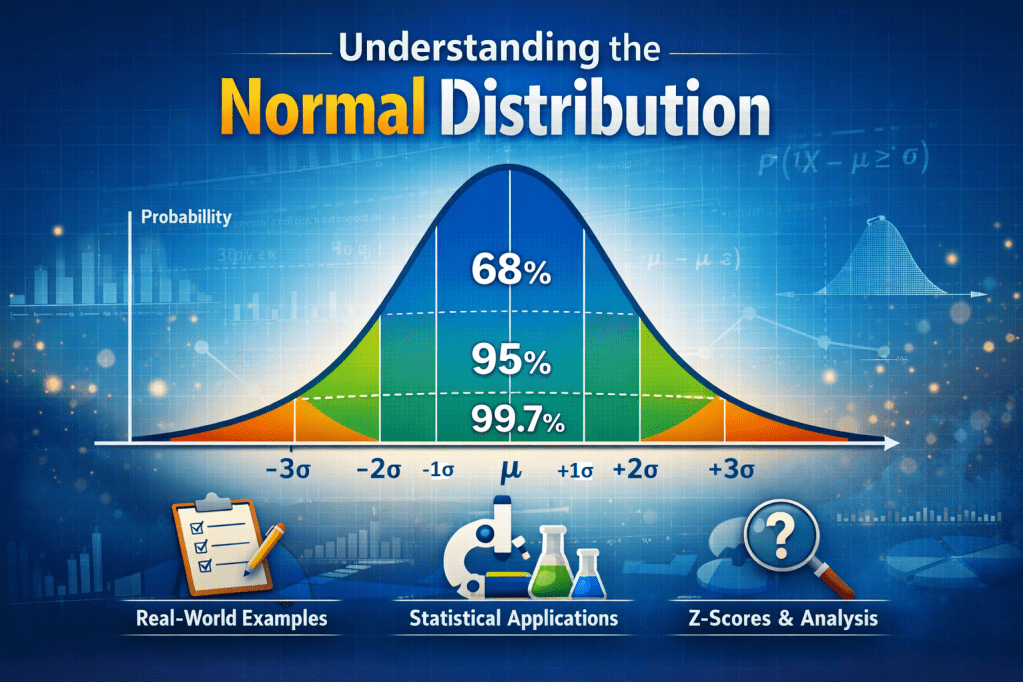
No Skew (Symmetrical): The mean, median, and mode are located centrally with normal distribution.
b. Kurtosis
- Definition: Measures the “tailedness” of the distribution.
- Leptokurtic: Heavy tails, sharp peak.
- Platykurtic: Light tails, flat peak.
- Mesokurtic: Normal distribution.
- Formula: Kurtosis =
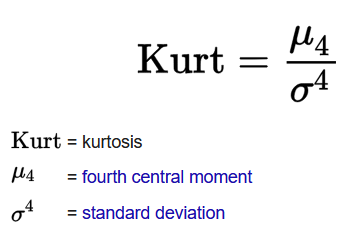
- Strengths: Useful for assessing extreme value likelihood.
- Limitations: Sensitive to outliers.
Kurtosis is simply an approximation of the distribution of the distribution mainly in the tailedness of the distributions where the tailedness represents the data points in the tails area of the distribution. There are three main ones: and Leptokurtic, Mesokurtic and platykurtic. In finance, kurtosis is useful in estimating the risk of unusual investment, where all the expenditures display a high kurtosis and suggest a high likelihood of excessive returns.
4. Why Are Summary Measures Important?
- Data Simplification: Condense large datasets into meaningful numbers.
- Decision-Making: Provide actionable insights for businesses, researchers, and policymakers.
- Comparative Analysis: Allow for comparisons between datasets.
- Data Quality Assessment: Help detect anomalies or data entry errors.
5. Applications of Summary Measures
- Business Analytics: Understanding customer behavior, sales trends, and financial performance.
- Healthcare: Analyzing patient data for better diagnosis and treatment.
- Education: Evaluating student performance metrics.
- Sports: Summarizing player statistics and team performance.
Conclusion
Summary measures in statistics play a vital role in understanding and interpreting data. Whether you’re analyzing trends in a business environment, conducting scientific research, or evaluating survey results, these measures provide the foundation for statistical analysis. By mastering these tools, you can unlock deeper insights and make data-driven decisions with confidence.


Leave a comment