
Introduction
As financial institutions increasingly rely on quantitative models for decision-making, the importance of independent model validation has grown significantly. Even a well-developed model can fail if not properly validated.
This is where the Model Validation Report (MVR) plays a crucial role. It provides an independent assessment of whether a model is fit for purpose, reliable, and compliant with regulatory expectations.
This article explores the structure, importance, and real-world application of MVRs in financial risk management.
What is a Model Validation Report (MVR)?
A Model Validation Report (MVR) is a formal document prepared by an independent validation team that evaluates a model’s:
- Conceptual soundness
- Implementation accuracy
- Performance and robustness
- Compliance with regulatory standards
Key Objective:
To ensure the model is appropriate for its intended use and does not expose the institution to undue risk.
Why is MVR Important in MRM?
Under regulatory frameworks like Basel guidelines and SR 11-7, financial institutions are required to maintain strong model validation practices.
Risks without proper validation:
- Incorrect credit decisions
- Underestimation of capital requirements
- Financial losses
- Regulatory penalties
MVR helps to:
- Provide independent assurance
- Identify model weaknesses
- Ensure regulatory compliance
- Support model approval decisions
Key Principles of Model Validation (SR 11-7 Aligned)
A strong MVR is built on three pillars:
1. Conceptual Soundness
- Is the model theory appropriate?
- Are assumptions valid?
2. Process Verification
- Is the model correctly implemented?
- Is the code accurate?
3. Outcomes Analysis
- Does the model perform well in practice?
Key Components of a Model Validation Report
1. Executive Summary
Purpose: Provide a high-level overview for senior management.
Includes:
- Validation scope
- Key findings
- Risk rating (Low/Medium/High)
- Final recommendation
Example:
The PD model is deemed fit for purpose with minor limitations. Overall risk rating: Medium.
2. Model Overview
Purpose: Describe the model being validated.
Includes:
- Model purpose
- Model type
- Business application
Example:
A retail credit PD model used for loan underwriting and IFRS 9 provisioning.
3. Validation Scope and Approach
Purpose: Define what was validated and how.
Includes:
- Validation tests performed
- Data used for validation
- Tools and techniques
Example:
- Benchmarking against challenger model
- Backtesting using out-of-sample data
4. Conceptual Soundness Review
Purpose: Evaluate model design and methodology.
Checks:
- Model choice justification
- Assumptions validity
- Variable selection logic
Example Finding:
Logistic regression is appropriate; however, macroeconomic variables are missing.
5. Data Validation
Purpose: Assess data quality and suitability.
Includes:
- Data completeness
- Accuracy
- Representativeness
Example Finding:
Missing values in income variable may bias results.
6. Process Verification (Implementation Review)
Purpose: Ensure the model is implemented correctly.
Includes:
- Code review
- Reperformance testing
- Data pipeline validation
Example:
Recalculated model outputs matched development results within acceptable tolerance.
7. Model Performance Evaluation
Purpose: Assess predictive power and stability.
Metrics:
- AUC / Gini
- KS statistic
- Accuracy / RMSE
Example:
- AUC: 0.80 (acceptable)
- Slight performance degradation in recent data
8. Benchmarking and Challenger Models
Purpose: Compare model with alternatives.
Example:
XGBoost challenger model shows higher AUC (0.86) but lower interpretability.
9. Sensitivity and Stress Testing
Purpose: Evaluate robustness under different conditions.
Includes:
- Scenario analysis
- Stress testing (e.g., recession scenario)
Example:
Model performance drops significantly under high unemployment scenarios.
10. Model Limitations and Findings
Purpose: Document key issues.
Types of Findings:
- Data issues
- Model design flaws
- Performance concerns
Example:
- Limited data for new customers
- Potential overfitting in ML model
11. Risk Rating
Purpose: Assign overall model risk.
Typical Scale:
- Low
- Medium
- High
Example:
Medium risk due to moderate data limitations and sensitivity to economic conditions.
12. Recommendations and Remediation
Purpose: Suggest improvements.
Example:
- Include macroeconomic variables
- Improve data quality
- Monitor model more frequently
13. Validation Conclusion
Purpose: Final decision on model usage.
Possible Outcomes:
- Approved
- Approved with conditions
- Not approved
Example:
Approved with conditions: quarterly monitoring required.
14. Governance and Compliance Check
Purpose: Ensure adherence to MRM framework.
Includes:
- SR 11-7 compliance
- Basel alignment
- IFRS 9 requirements
Practical Example: MVR for a Credit Risk Model
Scenario:
A bank validates a Probability of Default (PD) model
Key Findings:
- Model performs well (AUC = 0.80)
- Data quality issues identified
- ML challenger outperforms baseline model
Final Outcome:
- Approved with recommendations
- Monitoring frequency increased
Common Challenges in MVR Preparation
- Lack of independence in validation
- Insufficient documentation
- Over-reliance on model developers
- Weak testing frameworks
Best Practices for an Effective MVR
1. Maintain Independence
Validation must be separate from model development.
2. Be Evidence-Based
All conclusions should be supported by data and analysis.
3. Focus on Material Risks
Highlight issues that impact business decisions.
4. Ensure Clarity
Write for both technical and non-technical stakeholders.
5. Align with Regulations
Incorporate SR 11-7, Basel, and IFRS 9 expectations.
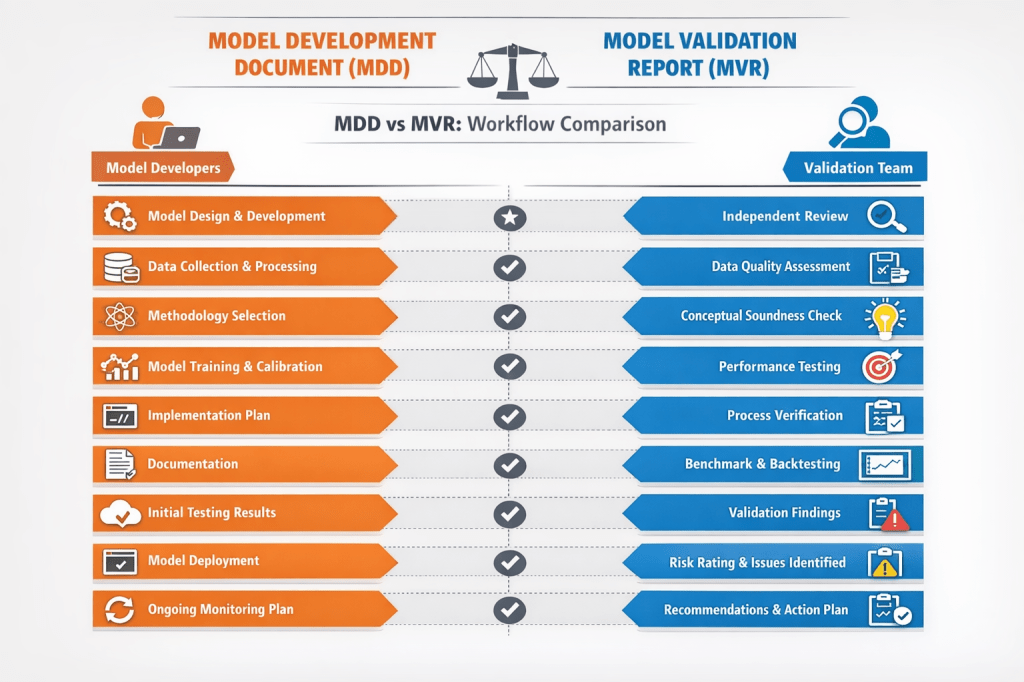
MDD vs MVR: Key Differences
| Aspect | MDD | MVR |
|---|---|---|
| Prepared by | Model Developers | Validation Team |
| Purpose | Explain model | Evaluate model |
| Focus | Development | Risk & performance |
| Audience | Internal teams | Regulators, auditors |
Sample Model Validation Report (MVR)
Model Validation Report (MVR)
Enterprise Credit Risk Model Suite (PD, LGD, EAD)
1. Executive Summary
Model Name: Enterprise Credit Risk Model Suite
Model ID: CR-IFRS9-ML-001
Validation Date: February 2026
Validation Team: Model Risk Management (MRM)
Overall Risk Rating: Medium
Validation Outcome: Approved with Conditions
Key Findings:
- Model framework is conceptually sound
- XGBoost model improves predictive power but raises explainability concerns
- Data quality issues identified in income and bureau variables
Key Recommendations:
- Enhance data quality controls
- Strengthen explainability for ML models
- Increase monitoring frequency
2. Model Overview
The model suite estimates:
- Probability of Default (PD)
- Loss Given Default (LGD)
- Exposure at Default (EAD)
Applications:
- Credit underwriting
- Capital calculation (Basel IRB)
- IFRS 9 Expected Credit Loss (ECL)
3. Validation Scope and Approach
Scope:
- PD, LGD, and EAD models
- Logistic regression and XGBoost models
Validation Tests Performed:
- Conceptual soundness review
- Data validation
- Code review and reperformance
- Benchmarking
- Backtesting
- Stress testing
4. Conceptual Soundness Review
Assessment:
- Model design aligns with industry standards
- Logistic regression appropriate for regulatory use
- XGBoost appropriate for performance enhancement
Findings:
- Lack of macroeconomic variables in base PD model
Rating: Satisfactory
5. Data Validation
Checks Performed:
- Completeness
- Accuracy
- Representativeness
Findings:
- Missing income data (~8%)
- Inconsistent bureau score updates
Impact: Moderate
Recommendation: Improve data governance framework
6. Process Verification (Implementation Review)
Activities:
- Code review (Python)
- Independent reimplementation
Results:
- Outputs matched within acceptable tolerance levels
Conclusion: Implementation is accurate
7. Model Performance Evaluation
| Metric | Logistic | XGBoost |
|---|---|---|
| AUC | 0.78 | 0.86 |
| Gini | 0.56 | 0.72 |
| KS | 0.42 | 0.55 |
Observation:
- ML model significantly outperforms baseline
- Slight degradation observed in recent data
8. Benchmarking & Challenger Models
Challenger Model: Gradient Boosting
Result:
- Comparable performance to XGBoost
Conclusion:
- XGBoost remains preferred model
9. Sensitivity & Stress Testing
Scenarios Tested:
- Economic downturn
- Increase in unemployment rate
Findings:
- PD increases significantly under stress
- Model shows sensitivity to macroeconomic shocks
10. Model Limitations & Findings
Key Limitations:
- Limited interpretability of ML models
- Data limitations for new customers
Key Findings:
- Potential overfitting risk in ML model
11. Model Risk Rating
| Risk Category | Rating |
|---|---|
| Data Risk | Medium |
| Model Risk | Medium |
| Implementation Risk | Low |
Overall Risk Rating: Medium
12. Recommendations & Remediation Plan
| Issue | Recommendation | Timeline |
|---|---|---|
| Data quality | Improve validation checks | 3 months |
| Explainability | Implement SHAP analysis | 2 months |
| Monitoring | Increase frequency | Immediate |
13. Regulatory Compliance Check
Basel IRB: Compliant
SR 11-7: Compliant with minor gaps
IFRS 9: Compliant
14. Validation Conclusion
The model is approved with conditions subject to:
- Implementation of recommendations
- Enhanced monitoring
15. Governance & Controls
Three Lines of Defense:
- Model Development Team
- Model Validation (MRM)
- Internal Audit
Committees:
- Model Risk Committee (MRC)
16. Appendices
Appendix A: Detailed Validation Testing (Formulas & Calculations)
A1. Discriminatory Power Metrics
1. Area Under Curve (AUC)
- Measures model’s ability to distinguish between defaulters and non-defaulters
Formula:
AUC = ∫ TPR d(FPR)
Where:
- TPR = True Positive Rate
- FPR = False Positive Rate
Example Calculation:
- AUC (Validation Sample) = 0.86 → Strong discriminatory power
2. Gini Coefficient
Formula:
Gini = 2 × AUC − 1
Example:
- AUC = 0.86 → Gini = 2 × 0.86 − 1 = 0.72
3. Kolmogorov-Smirnov (KS) Statistic
Formula:
KS = max|CDF_bad − CDF_good|
Example:
- Max difference = 0.55 → Strong separation
A2. Calibration Metrics
1. Brier Score
Formula:
Brier Score = (1/N) Σ (y_i − p_i)^2
Where:
- y_i = actual outcome (0/1)
- p_i = predicted probability
Example:
- Brier Score = 0.18 → Acceptable calibration
A3. Stability Metrics
1. Population Stability Index (PSI)
Formula:
PSI = Σ (Actual% − Expected%) × ln(Actual% / Expected%)
Interpretation:
- PSI < 0.1 → Stable
- 0.1–0.25 → Moderate shift
- 0.25 → Significant drift
Example:
- PSI = 0.18 → Moderate shift (monitor required)
2. Characteristic Stability Index (CSI)
Same formula as PSI but applied at variable level
Example:
- Income variable CSI = 0.22 → Potential instability
A4. Backtesting
Default Rate Comparison
Formula:
Error = |Observed Default Rate − Predicted PD|
Example:
- Observed DR = 5.5%
- Predicted PD = 5.2%
- Error = 0.3% → Acceptable
A5. Stress Testing Calculations
Scenario: Economic Downturn
Adjustment:
PD_stress = PD_base × Stress Multiplier
Example:
- Base PD = 5%
- Multiplier = 1.4
- Stressed PD = 7%
A6. IFRS 9 Expected Credit Loss (ECL)
Formula:
ECL = PD × LGD × EAD
Example:
- PD = 5%
- LGD = 40%
- EAD = $10,000
ECL = 0.05 × 0.40 × 10,000 = $200
A7. Overfitting Check (ML Models)
Metric: Difference between Train and Test AUC
Formula:
Overfitting Gap = AUC_train − AUC_test
Example:
- Train AUC = 0.90
- Test AUC = 0.86
- Gap = 0.04 → Acceptable
A8. Sensitivity Analysis
Approach:
- Increase/decrease input variables by ±10%
- Observe PD impact
Example:
- Income −10% → PD increases from 5% to 6.2%
Appendix B: Data Quality Reports
Appendix C: Benchmarking Results
Appendix D: Stress Testing Outputs
End of Model Validation Report
MDD vs MVR Workflow Diagram
Conclusion
The Model Validation Report (MVR) is a cornerstone of Model Risk Management (MRM). It ensures that models are not only technically sound but also reliable, compliant, and aligned with business needs.
In today’s regulatory environment, a strong MVR is not optional—it is essential for maintaining trust, transparency, and financial stability.
Quick MVR Template
- Executive Summary
- Model Overview
- Validation Scope
- Conceptual Review
- Data Validation
- Process Verification
- Performance Evaluation
- Benchmarking
- Stress Testing
- Findings & Limitations
- Risk Rating
- Recommendations
- Final Conclusion


Leave a comment