
Hypothesis testing is a fundamental concept in statistics and research that allows us to make data-driven decisions and draw meaningful conclusions. Whether you’re a researcher, data analyst, or business professional, understanding hypothesis testing is essential for interpreting data, validating assumptions, and solving problems. In this blog, we’ll explore what hypothesis testing is, how it works, its importance, and step-by-step guidance on conducting hypothesis tests.
What is Hypothesis Testing?
Hypothesis testing is a statistical method used to determine whether there is enough evidence in a sample of data to infer that a certain condition is true for the entire population. It involves making an initial assumption (the null hypothesis) and testing whether the observed data supports or contradicts this assumption.
Key Terms in Hypothesis Testing
- Null Hypothesis (H₀): The default assumption that there is no effect or no difference. It represents the status quo.
- Example: “There is no difference in sales performance between two marketing strategies.”
- Alternative Hypothesis (H₁ or Ha): The opposite of the null hypothesis. It represents what we aim to prove.
- Example: “There is a significant difference in sales performance between two marketing strategies.”
- Significance Level (α): The probability of rejecting the null hypothesis when it is true (Type I error). Common values are 0.05 (5%) or 0.01 (1%).
- p-value: The probability of observing the data (or something more extreme) if the null hypothesis is true. A low p-value (≤ α) suggests rejecting the null hypothesis.
- Test Statistic: A calculated value (e.g., t-score, z-score) used to determine the p-value.
- Type I and Type II Errors:
- Type I Error: Rejecting the null hypothesis when it is true (false positive).
- Type II Error: Failing to reject the null hypothesis when it is false (false negative).
Why is Hypothesis Testing Important?
Hypothesis testing is a cornerstone of scientific and data-driven decision-making. Here’s why it matters:
- Validates Assumptions: It helps test assumptions and theories using empirical data.
- Supports Decision-Making: It provides a structured framework for making informed decisions.
- Reduces Uncertainty: It quantifies the likelihood of observing results by chance.
- Drives Innovation: It enables researchers and businesses to test new ideas and strategies.
- Ensures Objectivity: It minimizes bias by relying on statistical evidence rather than intuition.
Steps in Hypothesis Testing
Hypothesis testing follows a systematic process. Here’s a step-by-step guide:
Step 1: State the Hypotheses
- Define the null hypothesis (H₀) and the alternative hypothesis (H₁).
- Example:
- H₀: The mean customer satisfaction score is 75.
- H₁: The mean customer satisfaction score is not 75.
Step 2: Choose the Significance Level (α)
- Select a significance level (e.g., 0.05) to determine the threshold for rejecting the null hypothesis.
Step 3: Select the Appropriate Test
- Choose a statistical test based on the type of data and research question. Common tests include:
- t-test: For comparing means of two groups.
- z-test: For large sample sizes with known population variance.
- Chi-square test: For testing relationships between categorical variables.
- ANOVA: For comparing means of three or more groups.
Step 4: Calculate the Test Statistic
- Use the sample data to compute the test statistic (e.g., t-score, z-score).
- Example: For a t-test, the formula is:
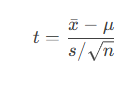
- Where:
 = sample mean
- μ = population mean (under H₀)
- s = sample standard deviation
- n = sample size
Step 5: Determine the p-value
- Use the test statistic to find the p-value, which indicates the probability of observing the data if the null hypothesis is true.
- Compare the p-value to the significance level (α).
Step 6: Make a Decision
- If p-value ≤ α, reject the null hypothesis (H₀) and accept the alternative hypothesis (H₁).
- If p-value > α, fail to reject the null hypothesis (H₀).
Step 7: Interpret the Results
- Explain the findings in the context of the research question.
- Example: “We reject the null hypothesis and conclude that there is a significant difference in customer satisfaction scores.”
Types of Hypothesis Tests
- One-Sample Tests:
- Compare a sample mean to a known population mean.
- Example: Testing if the average height of a sample differs from the national average.
- Two-Sample Tests:
- Compare the means of two independent samples.
- Example: Testing if there is a difference in sales between two regions.
- Paired Sample Tests:
- Compare means from the same group at different times or under different conditions.
- Example: Testing if employee productivity improves after a training program.
- One-Tailed vs. Two-Tailed Tests:
- One-Tailed: Tests for an effect in one direction (e.g., greater than or less than).
- Two-Tailed: Tests for an effect in both directions (e.g., not equal to).
Common Hypothesis Tests in Practice
- t-Test:
- Used for small sample sizes or when the population standard deviation is unknown.
- Example: Comparing the average test scores of two groups of students.
- z-Test:
- Used for large sample sizes or when the population standard deviation is known.
- Example: Testing if the proportion of defective products is less than 5%.
- Chi-Square Test:
- Used for categorical data to test relationships or goodness-of-fit.
- Example: Testing if there is an association between gender and product preference.
- ANOVA (Analysis of Variance):
- Used to compare means across three or more groups.
- Example: Testing if there are differences in employee satisfaction across departments.
Best Practices for Hypothesis Testing
- Define Clear Hypotheses: Ensure the null and alternative hypotheses are specific and testable.
- Choose the Right Test: Select a test that aligns with the data type and research question.
- Check Assumptions: Verify that the data meets the assumptions of the chosen test (e.g., normality, homogeneity of variance).
- Use Appropriate Software: Leverage statistical tools like Excel, SPSS, R, or Python for accurate calculations.
- Interpret Results Carefully: Avoid overgeneralizing findings and consider practical significance alongside statistical significance.
Real-World Example of Hypothesis Testing
Scenario: A company wants to test if a new website design increases the average time users spend on the site.
- State the Hypotheses:
- H₀: The average time spent on the new design is equal to the old design (μ = 3 minutes).
- H₁: The average time spent on the new design is greater than the old design (μ > 3 minutes).
- Choose Significance Level: α = 0.05.
- Select the Test: Use a one-sample t-test.
- Calculate the Test Statistic:
- Sample mean (xˉxˉ) = 3.5 minutes.
- Sample standard deviation (s) = 0.8 minutes.
- Sample size (n) = 50.
- t = (3.5 – 3) / (0.8 / √50) ≈ 4.42.
- Determine the p-value: p < 0.001.
- Make a Decision: Since p < 0.05, reject H₀.
- Interpret the Results: “The new website design significantly increases the average time users spend on the site.”
Conclusion
Hypothesis testing is a powerful tool for making data-driven decisions and validating assumptions. By following a structured approach, you can confidently test theories, solve problems, and draw meaningful conclusions from data. Whether you’re analyzing customer behavior, evaluating business strategies, or conducting academic research, mastering hypothesis testing is essential for success.
So, the next time you’re faced with a research question or business challenge, remember: hypothesis testing is your key to unlocking insights and driving evidence-based decisions. With practice and careful application, you’ll be well-equipped to navigate the complexities of data analysis and make a meaningful impact.


Leave a comment