
Author: Dr. Parvathi Jayaprakash, Ph.D (IIM-K), Assistant Professor – Business Analytics, IIPMB
In a data-driven world, Descriptive Analytics is the bedrock of informed decision-making. It helps businesses, governments, and individuals make sense of the past — not by guessing, but by summarizing data into meaningful insights. Whether you’re a business leader tracking quarterly revenue, a government department monitoring policy outcomes, or a non-profit analyzing outreach impact — the journey begins with understanding what has already happened.
Descriptive analytics does this by converting raw, often overwhelming datasets into clear, structured summaries. It answers foundational questions like: What were our sales last quarter? Which regions performed the best? How many customers dropped off this month? These insights aren’t predictions or prescriptions — they are the facts that ground every future strategy.
But don’t mistake descriptive analytics for just averages and pie charts. When applied thoughtfully, it evolves far beyond static reports. It becomes a dynamic, scalable framework that powers real-time dashboards, supports cross-functional collaboration, and even integrates with AI to automate insight generation. It can surface hidden patterns, alert you to anomalies, and provide up-to-the-minute snapshots that guide timely action.
In short, descriptive analytics is not merely a report card of the past — it’s the lens through which the present is understood, and the launching pad for every deeper level of analytics to come.
Let’s walk through the journey from basic summaries to AI-powered insight engines.
Level 1: The Basics — Understanding the Past
This is the entry point to analytics. Here, we transform raw, unstructured data into digestible summaries. The goal? To understand what happened and establish a factual foundation.
Core Techniques:
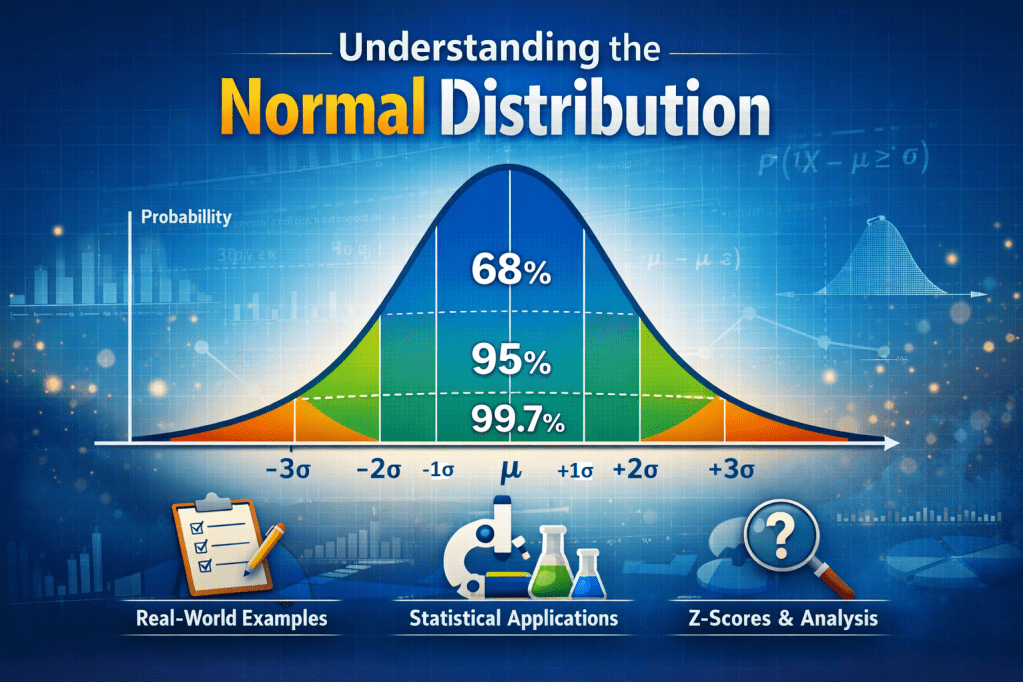
- Measures of central tendency: Mean, median, mode
- Measures of dispersion: Range, standard deviation, variance
- Tabulations: Frequency counts, percentages
- Cross-tabulations: Pivot tables for comparing variables
Real-World Example: Retail Chain Sales Analysis
A nationwide retail chain analyzes its sales data for June 2025 across 80 stores in 12 regions. Here’s what the descriptive analytics revealed:
- Kochi store outperformed all others, generating ₹1.8 crore in sales — 22% above the regional average.
- Just four product categories — home appliances, smartphones, personal care, and packaged foods — accounted for 61% of total sales, highlighting strong concentration in consumer demand.
- The average transaction value (ATV) fell by 8.2%, from ₹2,250 in May to ₹2,065 in June, despite a slight rise in footfall — indicating a shift towards smaller or lower-value purchases.
Business Implication: While overall revenue remained stable, the drop in ATV raised concerns about potential price sensitivity or product mix changes. The team decided to drill down further by analyzing customer segments and regional pricing strategies before rolling out upcoming monsoon campaigns.
Why It Matters: Just like reading a financial report, this level helps stakeholders grasp the status quo — essential before taking any action.
Level 2: Visual Storytelling — Making Data Speak
Numbers tell a story, but visuals help narrate it. Data visualization brings insights to life, enabling quicker understanding and collaboration.
Tools & Techniques:
- Bar/column charts: Compare categories
- Line charts: Spot trends over time
- Heatmaps: Identify density or outliers
- Dashboards: Combine multiple KPIs into a unified view
Tools: Excel, Power BI, Tableau, Looker, Google Data Studio
Real-World Example: Logistics Company Dashboard Insights
A mid-sized logistics firm operates across 15 cities in South India and uses a real-time dashboard to track key delivery metrics. Here’s how descriptive analytics through visual dashboards helps them stay on top of operations:
- Daily Delivery Performance: A line chart shows an average of 4,800 parcels delivered daily, with noticeable dips on Sundays and public holidays.
- On-Time Delivery by City: A heatmap reveals that while Mumbai and Chennai maintain a 96% on-time delivery rate, Bengaluru consistently lags at 82%, especially during peak traffic hours.
- Volume Trends Over Weeks: A bar chart comparison highlights a steady week-on-week increase in shipment volumes — with a 12% spike in the last week due to a regional e-commerce sale.
Business Implication: The operations team uses this dashboard to flag delays in real time, reassign delivery partners in underperforming zones, and plan for high-volume weeks more efficiently. Additionally, the city-level view helps regional managers drill down into issues like staffing, traffic congestion, or last-mile partner delays.
Why It Matters: A well-designed dashboard can highlight trends, detect red flags, and enable faster decisions, even for non-technical users.
Level 3: Aggregation & Drill-down — From Big Picture to Granular Views
At this level, descriptive analytics becomes interactive and layered. The goal is to zoom in from broad summaries to micro-level insights.
Key Concepts:
- Group-by aggregations: Summarize by region, segment, product
- Drill-down analysis: Explore from total → category → subcategory → transaction
- Time-series decomposition: Separate trends, seasonality, and outliers
Tools: SQL, Python (Pandas), BI platforms with slicing/dicing
Real-World Example: Telecom Company Analyzes Churn Drivers
A leading telecom operator with a pan-India presence conducts a monthly churn analysis to understand where and why customers are leaving the network. Their descriptive analytics dashboard, powered by SQL and Python-based drill-downs, uncovers key trends for June 2025:
- Churn rate in the Northeast region reached 4.8%, significantly higher than the national average of 2.9%.
- 72% of the churned users were on the Basic ₹199 prepaid plan, suggesting dissatisfaction with value-for-money in low-tier offerings.
- The churn spike correlates with the launch of a new data-heavy ₹149 plan by a key competitor in the same markets, offering better 4G coverage and bundled OTT access.
Business Implication: The marketing and product teams launched targeted win-back campaigns in the Northeast and re-evaluated the features of their basic plan. The churn dashboard also prompted leadership to initiate a deeper diagnostic analysis to model price sensitivity and segment-specific switching behaviour.
Why It Matters: This stage helps uncover the “where” and “who” of performance shifts, setting the stage for diagnostic analytics.
Level 4: Automation & Descriptive AI — From Reports to Smart Alerts
As data grows in volume and velocity, manual reporting becomes inefficient. Enter automation and AI — the final frontier of descriptive analytics.
Capabilities:
- Automated reporting: Scheduled dashboards, report subscriptions
- Natural Language Generation (NLG): Convert charts into plain-English summaries
- Anomaly detection: Real-time alerts on abnormal data behaviour
- Embedded analytics: Contextual insights inside business apps (CRM, ERP)
Tools: Tableau with Explain Data, Power BI with Smart Narratives, Narrative Science, ThoughtSpot, Zoho Analytics
Real-World Example: HR Platform Delivers Automated People Analytics
A cloud-based HR platform used by a large IT services firm auto-generates weekly workforce reports every Monday morning. Using built-in natural language generation (NLG) and embedded analytics, the platform highlights key workforce trends for HR managers — no manual intervention required.
Here’s what the system flagged this week:
- Rising Absenteeism: The platform detected a 32% week-on-week rise in unplanned leaves within the Application Support team — particularly among night-shift employees.
- Overtime Patterns: A bar graph shows consistent overtime (10+ hours/week) in the QA department over the past three weeks, with peaks coinciding with product release cycles.
- Suggested Intervention Areas: The system recommends closer attention to the Application Support team, citing potential burnout risks. It also suggests initiating a pulse survey to assess workload satisfaction.
Using pre-set business rules and thresholds, the HR platform auto-generates alerts, trends, and even commentary (e.g., “QA department clocked 15% more overtime than their 6-month average”).
Business Implication: With these automated insights, HR leaders can proactively address workforce issues, reduce attrition risks, and align resourcing with project timelines — all without waiting for quarterly reports or manual reviews.
Why It Matters: Automation allows businesses to scale insights and equip every decision-maker — not just analysts — with timely, intelligent feedback.
Beyond Descriptive: The Gateway to Advanced Analytics
Descriptive analytics shows you what happened. But once you’ve laid that foundation, you’re ready to dive deeper:
| Analytics Type | Key Question | Example Use Case |
| Diagnostic | Why did it happen? | Root cause of declining revenue |
| Predictive | What will happen? | Forecasting next month’s sales |
| Prescriptive | What should we do? | Recommending optimal pricing or promotions |
Think of descriptive analytics as the starting block of the analytics marathon — without it, every next step risks being misinformed.
Final Thoughts: Making Descriptive Analytics Work for You
To maximize impact, ensure your descriptive analytics is:
- Timely: Stale data leads to stale decisions
- Contextual: Numbers mean more when benchmarked
- Actionable: Deliver clear, business-relevant takeaways
Whether you’re building investor reports, customer insights, or team KPIs, the strength of your descriptive layer defines the clarity of your strategy.
Quick Summary
| Level | Focus | Key Tools | Outcomes |
| 1. Basic Summary | Averages, counts, trends | Excel, Python (pandas), Google Sheets | Understand performance over time |
| 2. Visuals | Charts, dashboards | Tableau, Power BI, Data Studio | Spot trends, engage stakeholders visually |
| 3. Drill-down | Segmentation, time patterns | SQL, OLAP, Python | Identify drivers of change |
| 4. Automation & AI | Real-time summaries, alerts | BI tools with NLG, ML-based alerts | Scale and democratize insights |
| ➕ Beyond | Diagnostic to Predictive | Regression, Forecasting models | Plan smarter and act faster |
Ready to Go Deeper?
In the next post, we’ll explore Diagnostic Analytics — the tools and techniques that explain why your KPIs move the way they do.
REFERENCES
- Investopedia. (2024) Descriptive Analytics. Retrieved from https://www.investopedia.com/terms/d/descriptive-analytics.asp
- Harvard Business School Online. (2022). What Is Descriptive Analytics?. Retrieved from https://online.hbs.edu/blog/post/descriptive-analytics
- ThoughtSpot. (2025.). Descriptive Analytics: What, Why, and How. Retrieved from https://www.thoughtspot.com/data-trends/analytics/what-is-descriptive-analytics
- Sprinkle Data. (2023). What is Descriptive Analytics?. Retrieved from https://www.sprinkledata.com/blogs/what-is-descriptive-analytics
- Pluralsight. (2019.). Data-Informed Decisions: Descriptive Analytics. Retrieved from https://www.pluralsight.com/resources/blog/ai-and-data/data-informed-decisions
- Deepint.ai. (2023.). Natural Language Generation (NLG). Retrieved from https://deepint.ai/natural-language-generation
- Arria NLG. (2021). Anomaly Detection with Automation and NLG. Retrieved from https://www.arria.com/blog/anomaly-detection-with-automation-and-nlg
- Brath R & Hagerman C (2021). NLG Auto Insight Annotations. Retrieved from https://uncharted.software/assets/NLG_Auto_Insight_Annotations_20210324.pdf


Leave a comment