

🌟 Introduction
Building a machine learning model is only half the job. The real challenge lies in evaluating how well the model performs and whether it can be trusted for real-world decision-making.
Performance evaluation metrics help us:
- Compare different models
- Detect overfitting or underfitting
- Understand business impact
- Choose the right model for deployment
Since regression and classification problems are fundamentally different, their evaluation metrics also differ.
🔍 Why Performance Metrics Matter
A model with high accuracy may still be useless or dangerous in practice.
Example:
- In fraud detection, predicting “No Fraud” for all transactions may give 99% accuracy, but it completely fails the business objective.
👉 Hence, choosing the right evaluation metric is as important as choosing the algorithm.
📈 Evaluation Metrics for Regression Models
Regression models predict continuous numerical values.
1️⃣ Mean Absolute Error (MAE)
Definition
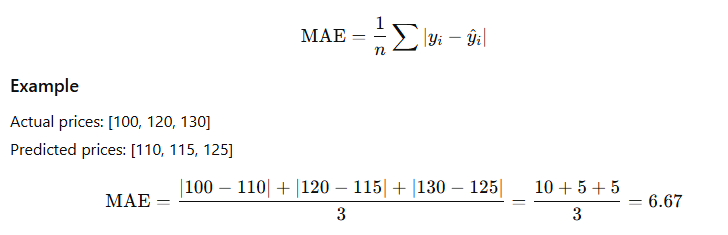
MAE measures the average absolute difference between actual and predicted values.
✅ Easy to interpret
❌ Treats all errors equally
2️⃣ Mean Squared Error (MSE)
Definition
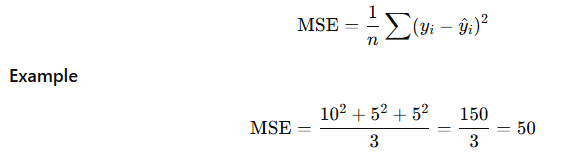
MSE squares the errors, penalizing large mistakes more heavily.
✅ Useful when large errors are costly
❌ Units are squared (harder to interpret)
3️⃣ Root Mean Squared Error (RMSE)
Definition
Square root of MSE — brings error back to original units.

📌 Commonly used in forecasting and finance.
4️⃣ R-squared (R²)
Definition
Measures the proportion of variance explained by the model.

Interpretation
- R² = 0.80 → Model explains 80% of variability
- R² = 1 → Perfect fit
- R² = 0 → No explanatory power
❌ Can be misleading with many features
5️⃣ Adjusted R²
Improves upon R² by penalizing unnecessary predictors.
📌 Preferred for multiple regression models.
✅ Summary: Regression Metrics
| Metric | Best Used When |
|---|---|
| MAE | Interpretability matters |
| RMSE | Large errors are critical |
| R² | Explaining variability |
| Adjusted R² | Multiple predictors |
🧠 Evaluation Metrics for Classification Models
Classification models predict categorical labels.
1️⃣ Confusion Matrix
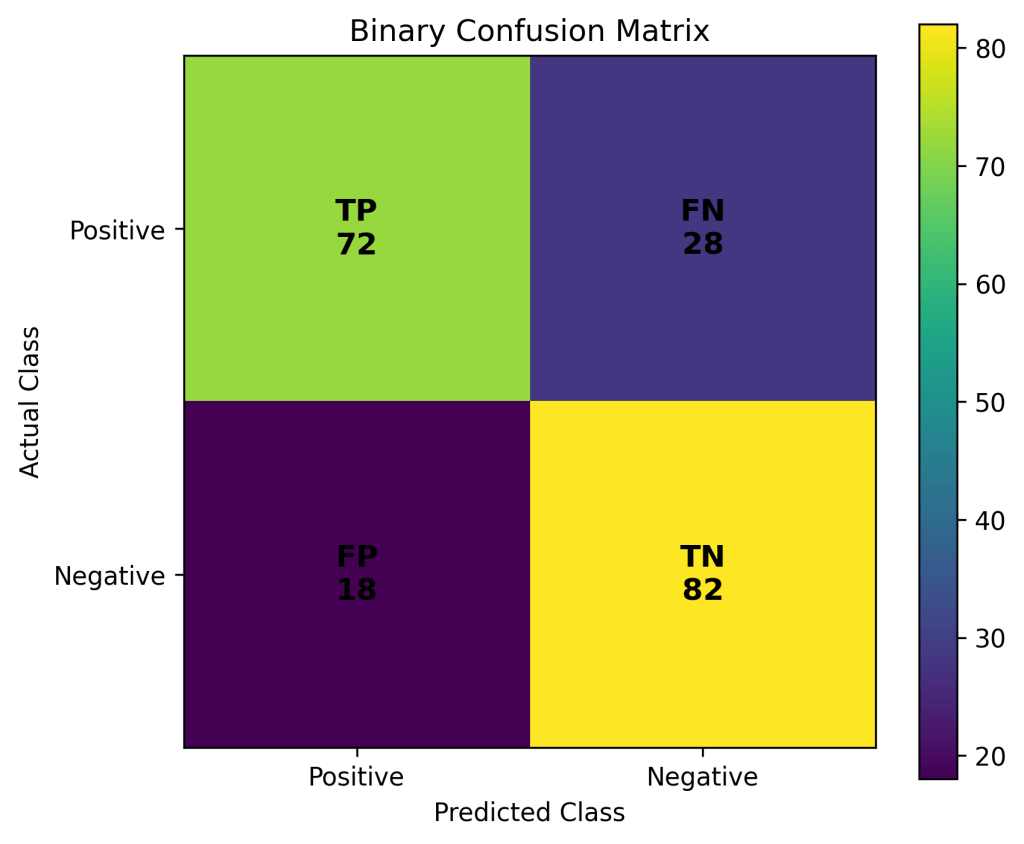
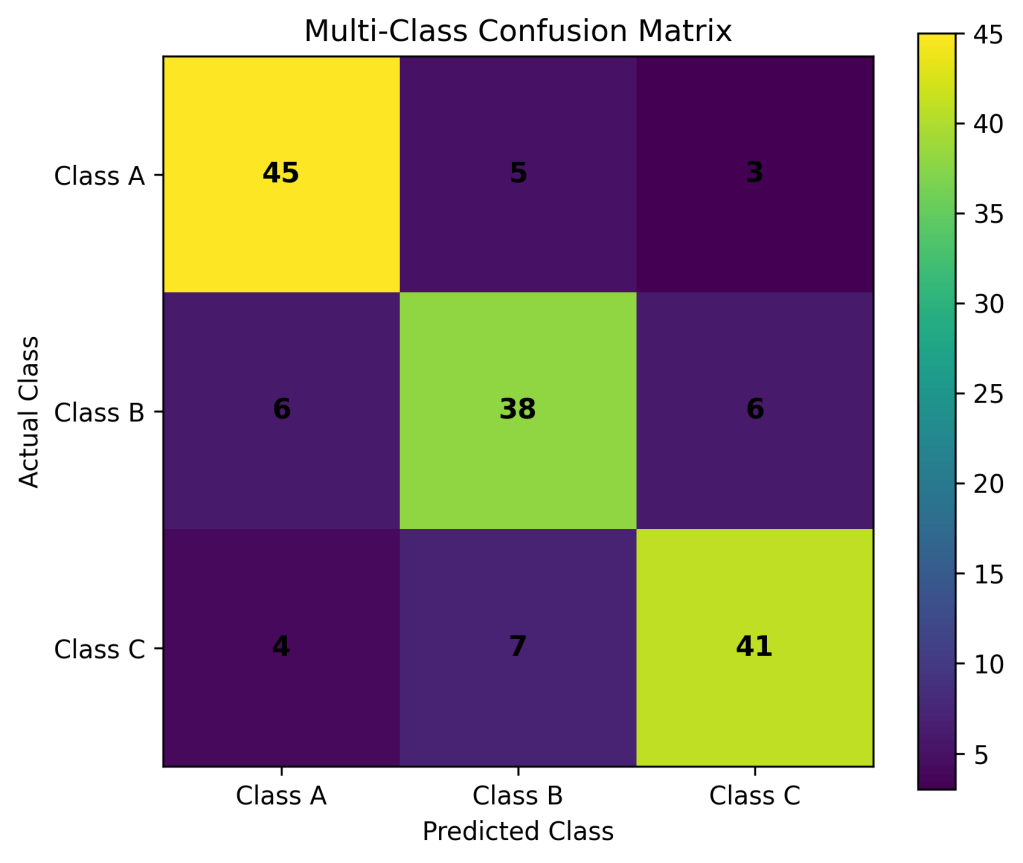
A confusion matrix summarizes predictions vs actual outcomes.
| Actual \ Predicted | Positive | Negative |
|---|---|---|
| Positive | TP | FN |
| Negative | FP | TN |
- TP: True Positive
- FP: False Positive
- FN: False Negative
- TN: True Negative
2️⃣ Accuracy
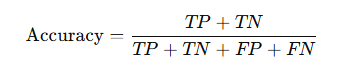
Example
TP = 40, TN = 50, FP = 5, FN = 5
Accuracy = (40 + 50) / 100 = 90%
❌ Misleading for imbalanced datasets
3️⃣ Precision
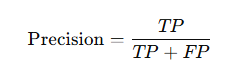
👉 Of all predicted positives, how many were correct?
📌 Important in spam detection, fraud detection.
4️⃣ Recall (Sensitivity / True Positive Rate)
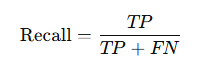
👉 Of all actual positives, how many did we capture?
📌 Critical in medical diagnosis, safety systems.
5️⃣ F1-Score
Harmonic mean of precision and recall:

📌 Best when dealing with imbalanced classes.
6️⃣ Specificity (True Negative Rate)

📌 Important in screening tests.
7️⃣ ROC Curve and AUC
- ROC Curve: Plots True Positive Rate vs False Positive Rate
- AUC: Area Under ROC Curve
Interpretation:
- AUC = 0.5 → Random guessing
- AUC = 1.0 → Perfect classifier
📌 Popular in finance and healthcare.
8️⃣ Log Loss (Cross-Entropy Loss)
Measures how confident the classifier’s probability estimates are.
Lower log loss = better probability calibration.
✅ Summary: Classification Metrics
| Metric | Focus |
|---|---|
| Accuracy | Overall correctness |
| Precision | False positives |
| Recall | False negatives |
| F1-score | Balance of precision & recall |
| ROC–AUC | Ranking ability |
🔁 Choosing the Right Metric (Business View)
| Problem | Recommended Metric |
|---|---|
| Fraud detection | Recall, F1-score |
| Medical diagnosis | Recall, Specificity |
| Spam filtering | Precision |
| Credit scoring | ROC–AUC |
| Sales forecasting | RMSE |
| Demand planning | MAE |
⚠️ Common Mistakes in Model Evaluation
- Using accuracy for imbalanced datasets
- Comparing models using different test sets
- Ignoring business costs of errors
- Evaluating only on training data
- Misinterpreting R² as “accuracy”
🧪 Simple Python Example
from sklearn.metrics import mean_absolute_error, accuracy_score, classification_report

# Regression
mae = mean_absolute_error(y_true, y_pred)

# Classification
accuracy = accuracy_score(y_true, y_pred)
print(classification_report(y_true, y_pred))
🧾 Key Takeaways
✔ Metrics must match the problem type
✔ Business context matters more than raw accuracy
✔ Use multiple metrics, not just one
✔ Always validate using unseen data
📚 References & Further Reading
- Hastie, T., Tibshirani, R., & Friedman, J. (2017). The Elements of Statistical Learning. Springer.
- James, G., et al. (2021). An Introduction to Statistical Learning. Springer.
- Géron, A. (2022). Hands-On Machine Learning with Scikit-Learn, Keras & TensorFlow. O’Reilly.
- Bishop, C. (2006). Pattern Recognition and Machine Learning. Springer.
- scikit-learn Documentation – Model Evaluation
https://scikit-learn.org/stable/modules/model_evaluation.html - Google ML Crash Course – Classification Metrics








Leave a Reply