

🌟 Introduction
In many real-world problems, labels are not available. We may not know in advance:
- Which customers belong to which segment
- Which products behave similarly
- Which regions have similar consumption patterns
This is where clustering comes in.
Clustering is an unsupervised machine learning technique that groups data points such that:
- Objects within the same cluster are similar
- Objects across clusters are dissimilar
Clustering is widely used in marketing, finance, healthcare, agriculture, image processing, and anomaly detection.
📌 What is Clustering?
Clustering aims to partition data into meaningful subgroups based on similarity or distance.
Key characteristics:
- No target variable (unlabeled data)
- Pattern discovery and exploratory analysis
- Often the first step in data understanding
🧭 Types of Clustering Approaches
| Category | Examples |
|---|---|
| Partition-based | K-Means |
| Hierarchical | Agglomerative, Divisive |
| Density-based | DBSCAN |
| Model-based | Gaussian Mixture Models |
| Graph-based | Spectral Clustering |
🔵 1. K-Means Clustering
📌 Concept
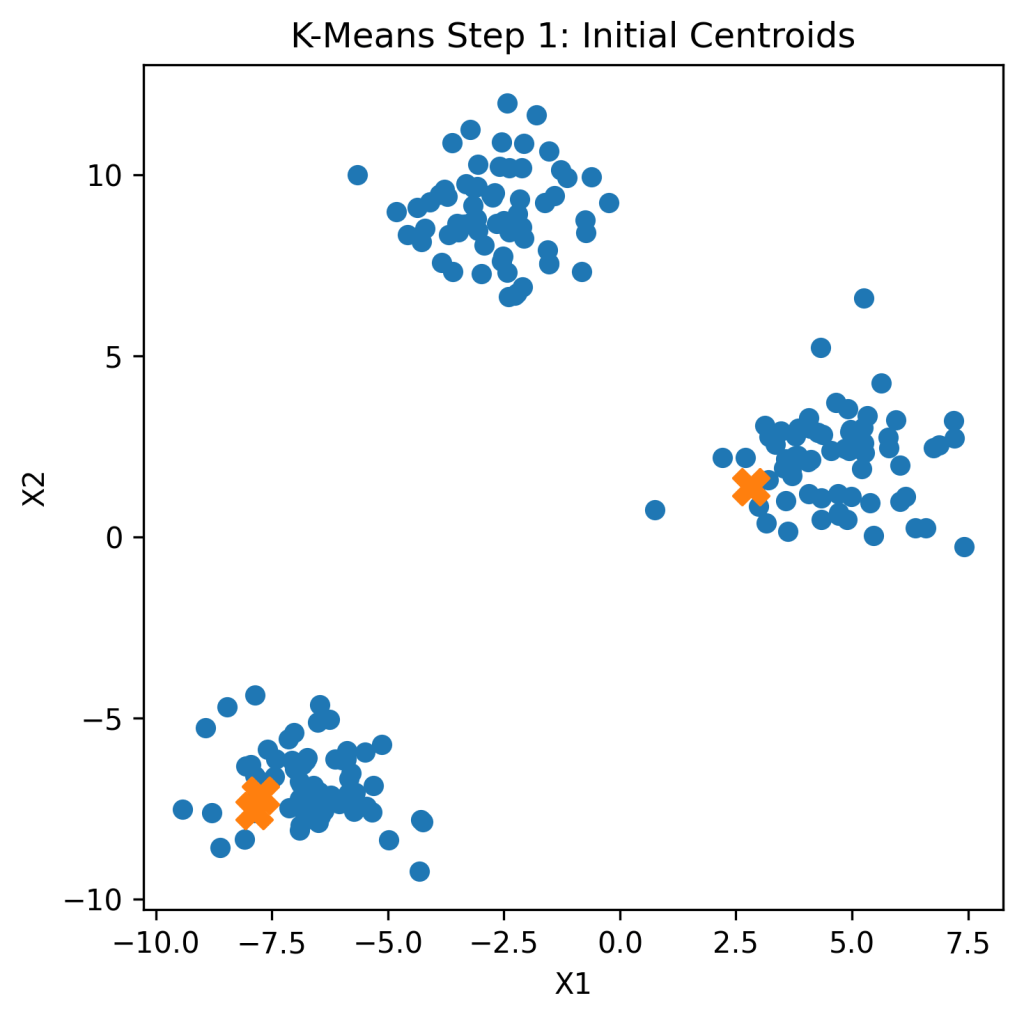
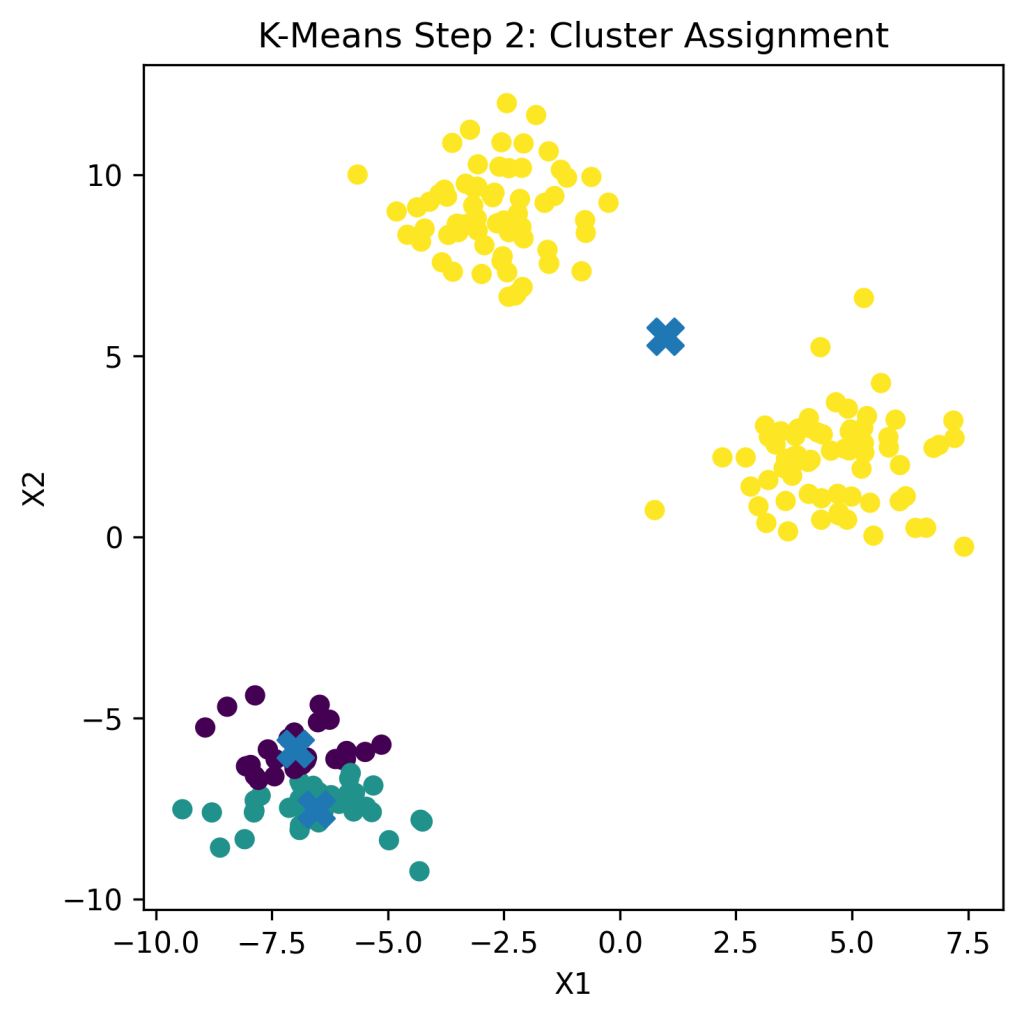
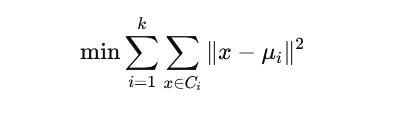
K-Means partitions data into K clusters, where each cluster is represented by its centroid.
Algorithm Steps
- Choose number of clusters (K)
- Initialize centroids randomly
- Assign points to nearest centroid
- Update centroids
- Repeat until convergence
🧮 Objective Function
📊 Example: Customer Segmentation
Features:
- Annual income
- Spending score
Outcome:
- Cluster 1: High income – High spenders
- Cluster 2: Low income – Low spenders
- Cluster 3: High income – Low spenders
📌 Used heavily in retail and marketing analytics.
✅ Pros and ❌ Cons
✔ Simple and fast
✔ Scales well to large datasets
✘ Requires predefined K
✘ Sensitive to outliers
✘ Assumes spherical clusters
🌲 2. Hierarchical Clustering
📌 Concept
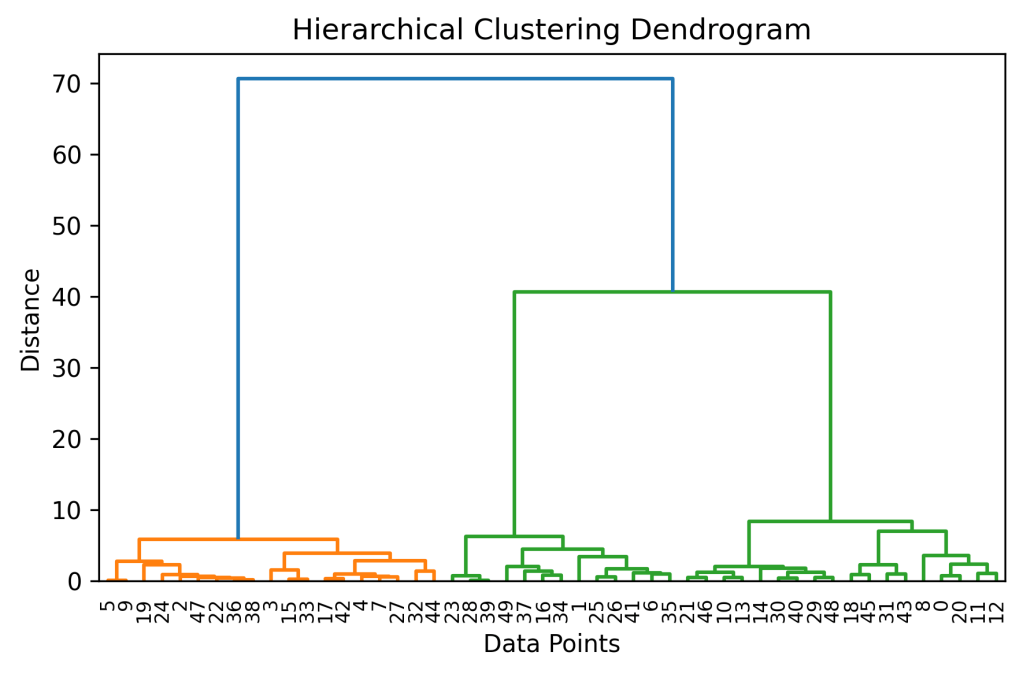
Hierarchical clustering builds a tree of clusters (dendrogram).
Types
- Agglomerative (bottom-up)
- Divisive (top-down)
📊 Example: Product Similarity Analysis
Products grouped based on:
- Price
- Category
- Purchase frequency
Dendrogram helps decide optimal number of clusters visually.
✅ Pros and ❌ Cons
✔ No need to predefine K
✔ Interpretability via dendrogram
✘ Computationally expensive
✘ Not suitable for very large datasets
🟢 3. DBSCAN (Density-Based Clustering)
📌 Concept
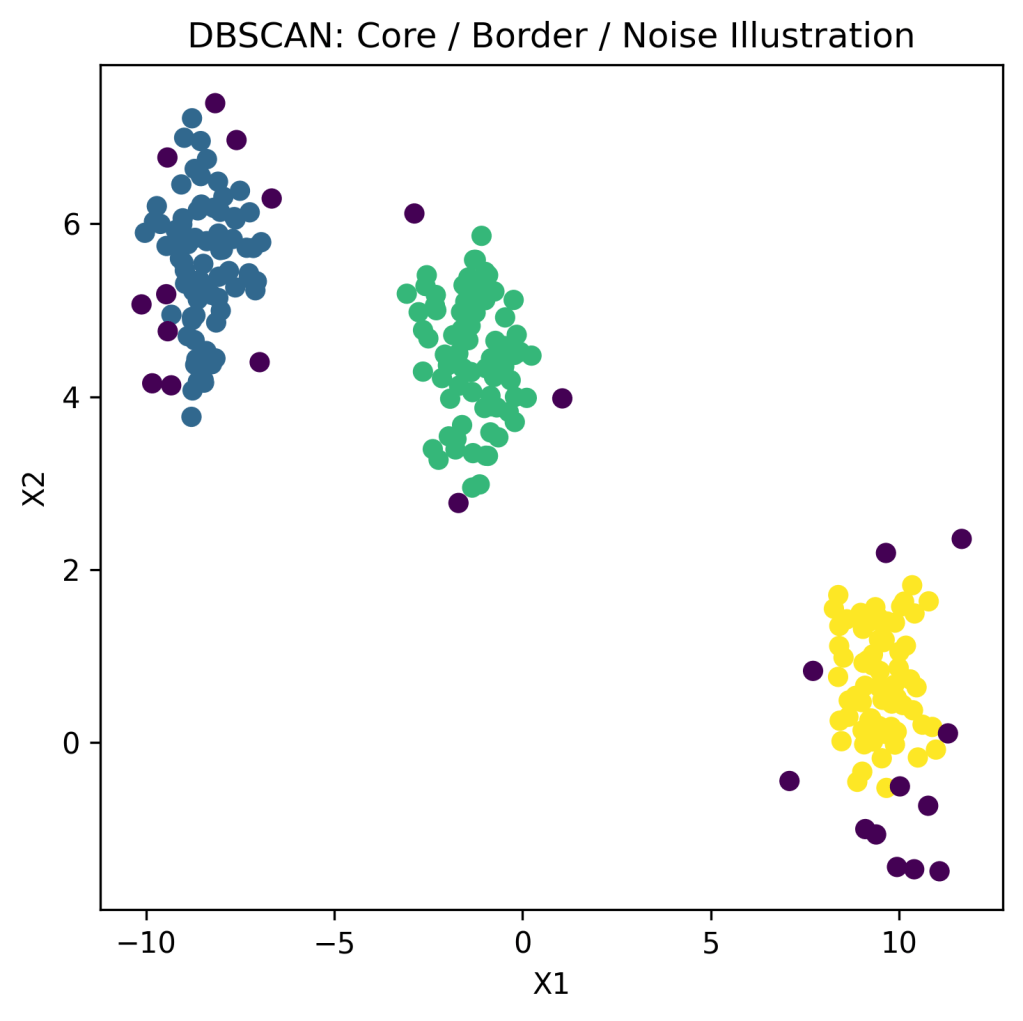
DBSCAN groups points based on density, identifying:
- Dense clusters
- Noise/outliers
Key Parameters
- ε (epsilon) – neighborhood radius
- MinPts – minimum points required to form a cluster
📊 Example: Fraud & Anomaly Detection
- Dense regions → normal behavior
- Sparse points → anomalies or fraud
📌 Used in cybersecurity and financial analytics.
✅ Pros and ❌ Cons
✔ Finds arbitrarily shaped clusters
✔ Detects outliers automatically
✘ Sensitive to parameter choice
✘ Struggles with varying densities
🟣 4. Gaussian Mixture Models (GMM)
📌 Concept
GMM assumes data is generated from a mixture of Gaussian distributions.
Key Feature
- Soft clustering (probabilistic membership)
📊 Example: Customer Risk Profiling
A customer may belong:
- 70% to Medium Risk
- 30% to High Risk
📌 Useful when clusters overlap.
✅ Pros and ❌ Cons
✔ Flexible cluster shapes
✔ Probabilistic interpretation
✘ Computationally expensive
✘ Assumes Gaussian distribution
🟡 5. Spectral Clustering (Brief)
- Graph-based approach
- Uses eigenvectors of similarity matrix
- Effective for complex, non-convex clusters
📌 Used in image segmentation and network analysis.
📏 Evaluating Clustering Quality
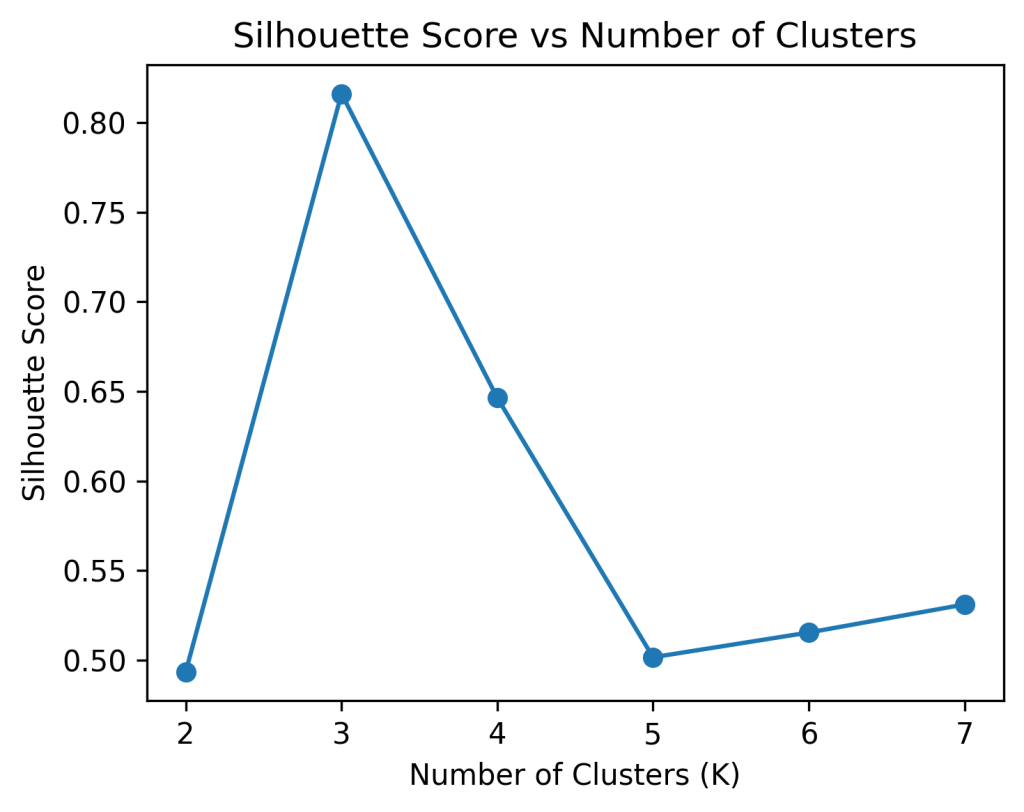
Since no labels exist, evaluation uses internal metrics:
| Metric | Meaning |
|---|---|
| Silhouette Score | Separation & cohesion |
| Davies–Bouldin Index | Cluster compactness |
| Calinski–Harabasz | Variance ratio |
| Elbow Method | Optimal K (K-Means) |

🔁 Comparison of Major Clustering Algorithms
| Algorithm | Needs K | Handles Noise | Cluster Shape |
|---|---|---|---|
| K-Means | Yes | No | Spherical |
| Hierarchical | No | No | Flexible |
| DBSCAN | No | Yes | Arbitrary |
| GMM | Yes | No | Elliptical |
🧪 Python Example (K-Means)
from sklearn.cluster import KMeans

kmeans = KMeans(n_clusters=3, random_state=42)
labels = kmeans.fit_predict(X)
🌍 Real-World Applications
| Domain | Use Case |
|---|---|
| Marketing | Customer segmentation |
| Finance | Risk grouping |
| Healthcare | Patient phenotyping |
| Agriculture | Soil & crop zoning |
| Retail | Product categorization |
| Cybersecurity | Intrusion detection |
⚠️ Common Pitfalls
- Scaling not performed before clustering
- Arbitrary choice of K
- Interpreting clusters as ground truth
- Using wrong distance metric
🧾 Key Takeaways
✔ Clustering discovers hidden structure
✔ Different algorithms suit different data shapes
✔ No single “best” clustering method
✔ Visualization is crucial for interpretation
📚 References & Further Reading
- Hastie, T., Tibshirani, R., & Friedman, J. (2017). The Elements of Statistical Learning. Springer.
- James, G., et al. (2021). An Introduction to Statistical Learning. Springer.
- Bishop, C. (2006). Pattern Recognition and Machine Learning. Springer.
- Ester et al. (1996). A Density-Based Algorithm for Discovering Clusters (DBSCAN).
- scikit-learn Documentation – Clustering
https://scikit-learn.org/stable/modules/clustering.html - Kaggle Learn – Unsupervised Learning





Leave a Reply