

When we describe data using mean, median, mode, and standard deviation, we understand its center and spread.
But to truly grasp how data behaves, we must also understand its shape — that’s where Skewness and Kurtosis come in.
Let’s explore what they mean, how to calculate them, and how to interpret them with examples.
🎯 What is Skewness?
Skewness measures the asymmetry (or tilt) of a data distribution.
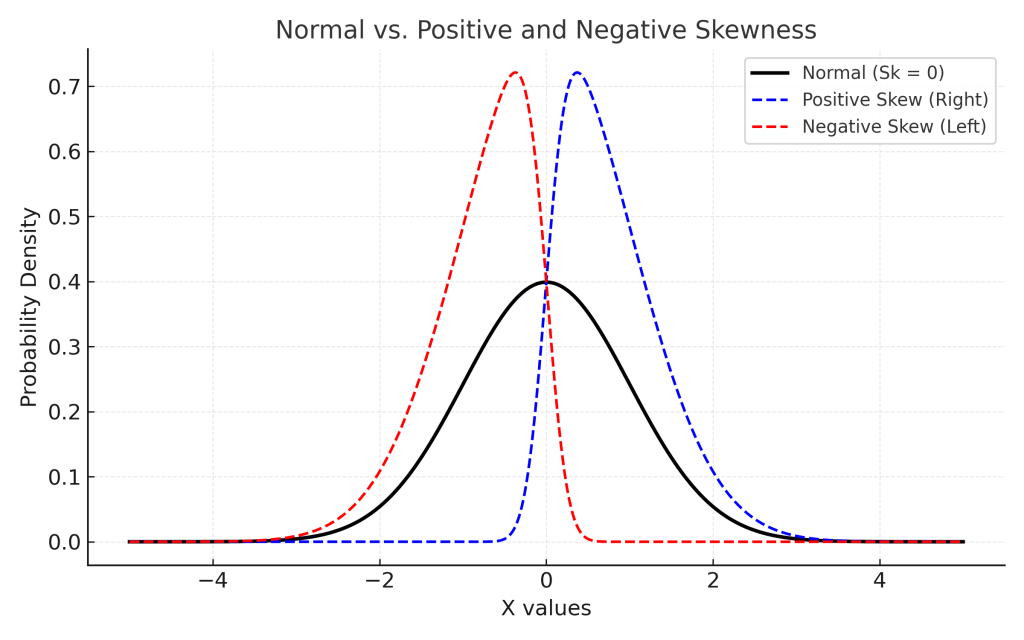
- A symmetric distribution (like the normal curve) has equal tails on both sides.
- A positively skewed (right-skewed) distribution has a longer right tail — meaning there are a few large values pulling the mean to the right.
- A negatively skewed (left-skewed) distribution has a longer left tail — meaning there are a few small values pulling the mean to the left.
👉 Types of Skewness
| Type | Description | Mean–Median–Mode Relationship | Shape |
|---|---|---|---|
| Symmetrical | Data evenly distributed | Mean = Median = Mode |  |
| Positively skewed | Tail on right | Mean > Median > Mode | Tail stretches right |
| Negatively skewed | Tail on left | Mean < Median < Mode | Tail stretches left |
🧮 Formula for Skewness
There are several measures, but the most common are:
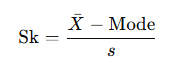
1. Karl Pearson’s Coefficient of Skewness
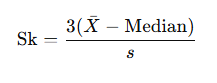
If the mode is not known, you can use:
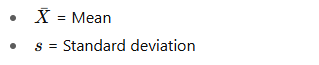
Where:
2. Moment-based Coefficient (Population formula)
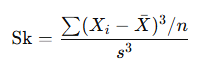
If Sk > 0 → right skewed;
If Sk < 0 → left skewed.
💡 Example 1: Calculating Skewness (Karl Pearson’s method)
| Value (X) | Frequency (f) |
|---|---|
| 10 | 2 |
| 20 | 4 |
| 30 | 6 |
| 40 | 5 |
| 50 | 3 |
Compute:

Median class lies near 30–40 → approximate Median = 34 (using cumulative frequency).
Mode ≈ 30 (highest frequency).
Standard deviation (given or computed) (s = 11.18)

✅ Interpretation:
Since Sk = +0.40, the distribution is positively skewed — slightly right-tailed.
📈 What is Kurtosis?
Kurtosis measures the peakedness or flatness of a data distribution compared to a normal distribution.
While skewness tells us direction, kurtosis tells us sharpness — how concentrated or spread out the tails are.
🧮 Formula for Kurtosis
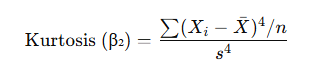
We often express excess kurtosis as:
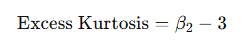
Where 3 is the kurtosis of a normal distribution.
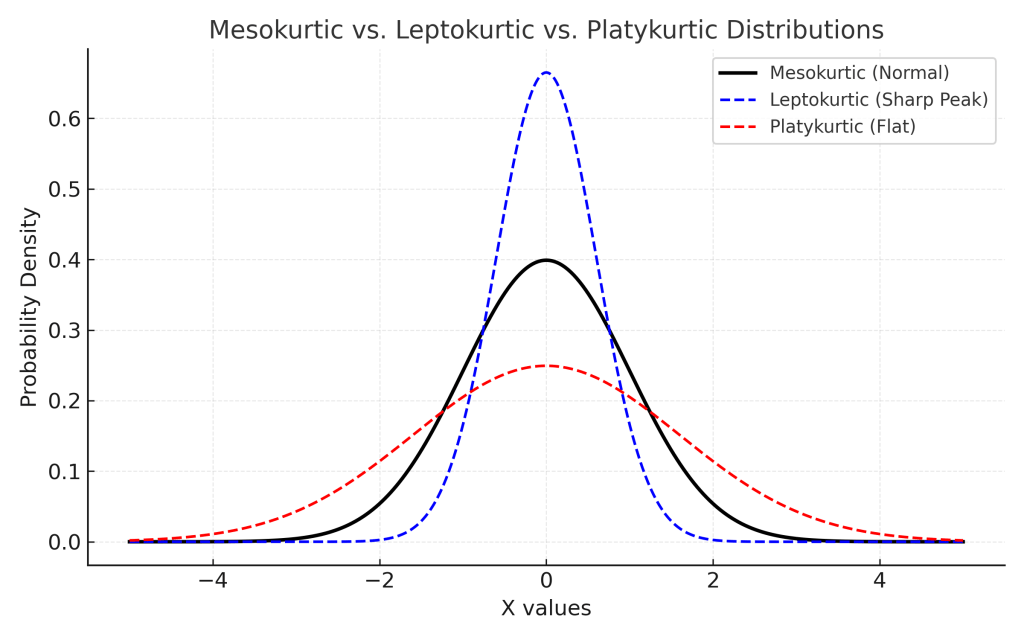
🌄 Types of Kurtosis
| Type | Excess Kurtosis | Description | Shape |
|---|---|---|---|
| Mesokurtic | = 0 | Normal curve | Moderate peak |
| Leptokurtic | > 0 | Heavy tails, sharper peak | Tall and thin |
| Platykurtic | < 0 | Light tails, flatter top | Broad and flat |
💡 Example 2: Calculating Kurtosis
Suppose the following data represents test scores of 5 students:
| X | 60 | 65 | 70 | 75 | 80 |
|---|
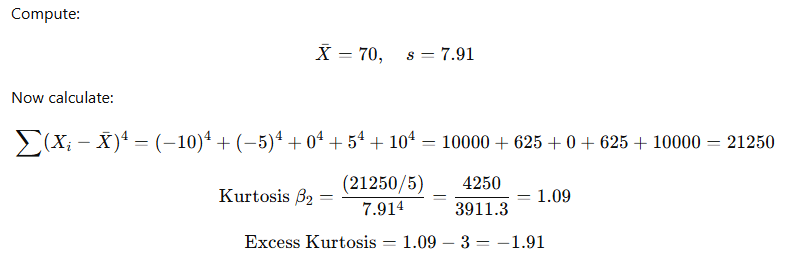
✅ Interpretation:
The data is platykurtic, meaning it’s flatter than the normal curve — values are more evenly spread out.
🔍 Quick Comparison
| Measure | Meaning | Normal Distribution Value | Indicates |
|---|---|---|---|
| Skewness | Symmetry | 0 | +ve → right tail, −ve → left tail |
| Kurtosis | Peakedness | 3 (or 0 excess) | +ve → sharper, −ve → flatter |
🧠 Practical Insights
- Skewness affects mean–median relationship, influencing how averages misrepresent the data.
- Kurtosis helps identify outliers and risk — especially in finance, where leptokurtic returns mean extreme highs and lows.
✍️ Final Thoughts
Understanding Skewness and Kurtosis is essential for interpreting data beyond averages.
A dataset might have the same mean and standard deviation but look completely different when visualized — because its shape matters.
Next time you analyze data, take a moment to check:
- Is it skewed?
- Is it flat or peaked?
These insights can make your interpretation much more accurate and powerful.
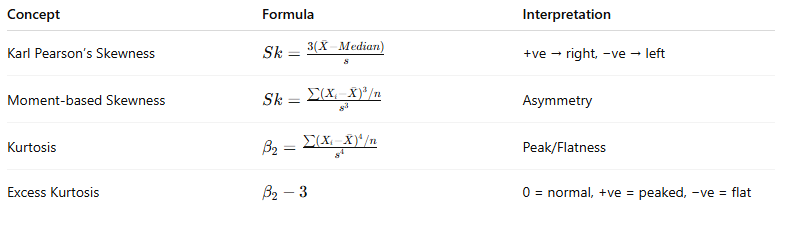
📘 Summary Formula Sheet
📚 Further Reading
- Field, A. (2013). Discovering Statistics Using IBM SPSS Statistics. SAGE Publications.
A comprehensive text that explains skewness and kurtosis with practical SPSS-based examples, ideal for applied learners. - Keller, G. (2017). Statistics for Management and Economics. Cengage Learning.
Provides an intuitive explanation of distribution shapes and their importance in managerial decision-making. - Wackerly, D., Mendenhall, W., & Scheaffer, R. L. (2014). Mathematical Statistics with Applications. Cengage Learning.
Offers the theoretical foundation and derivation of skewness and kurtosis measures. - Wikipedia: Skewness | Kurtosis
Excellent for quick conceptual refreshers with mathematical definitions and examples. - Khan Academy: Shape of Distributions – Skewness and Kurtosis
Easy-to-follow visual explanations suitable for beginners and students. - Laerd Statistics: Assessing Normality using Skewness and Kurtosis
Practical interpretation guide — explains how to interpret skewness and kurtosis values when checking for normality.








Leave a Reply