
Statistical analysis can feel overwhelming—especially when you’re faced with choosing the right test for your data. Should you use a t-test? ANOVA? Chi-square?
This guide breaks everything down in a simple, practical way using real-world examples and clear decision rules.
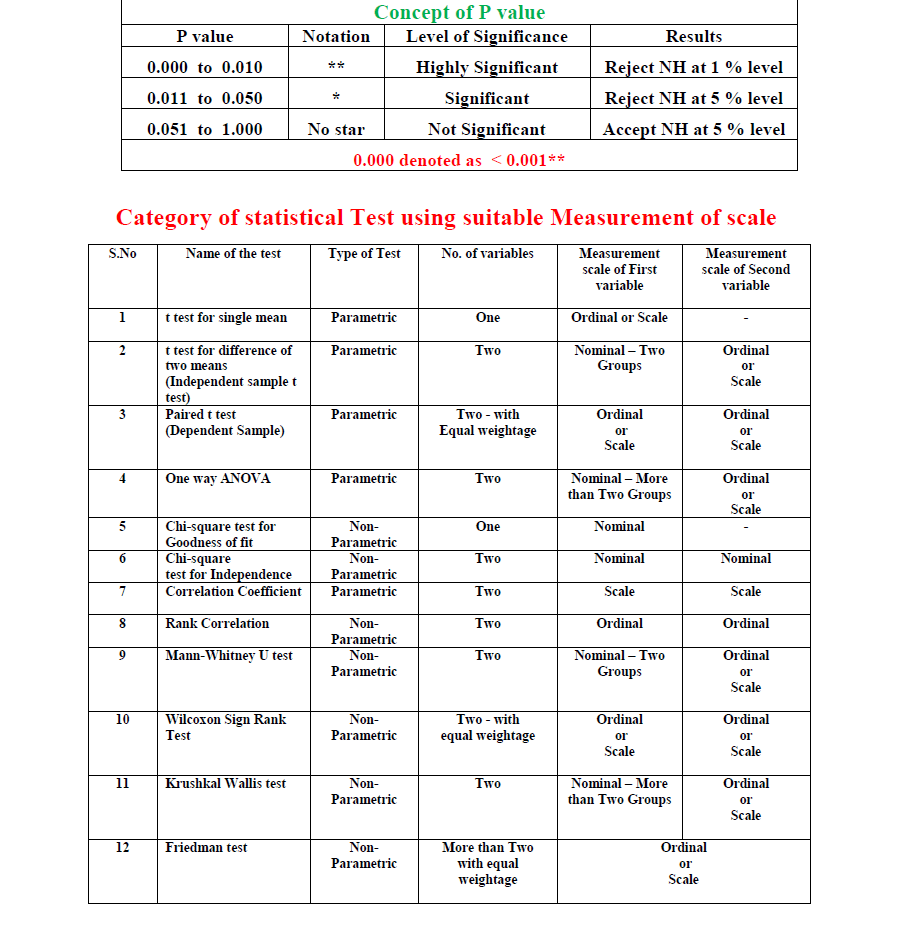
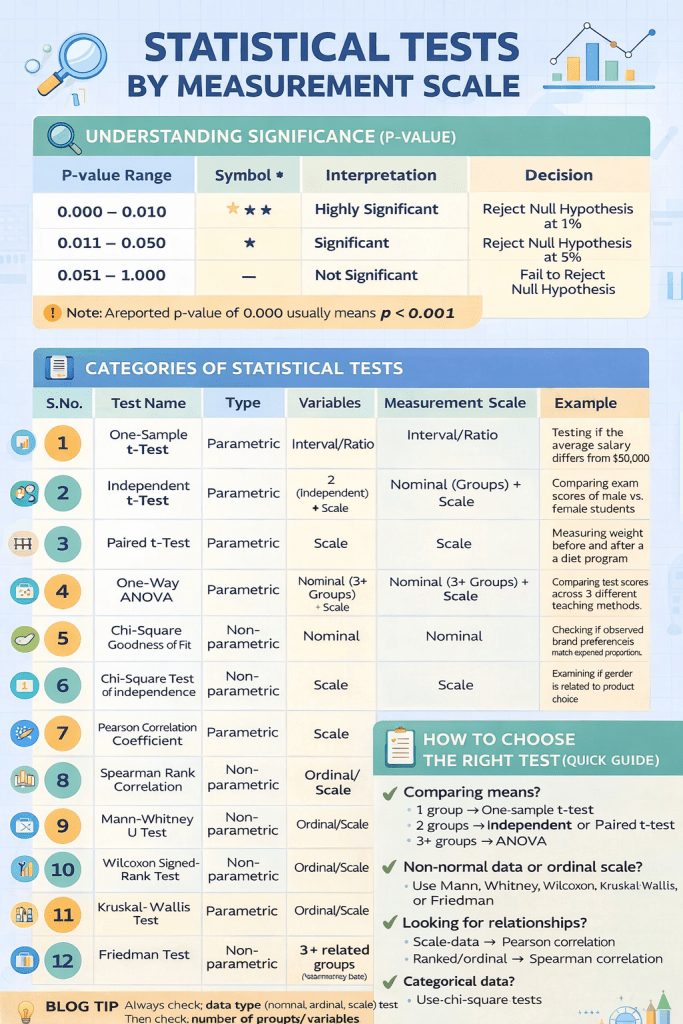
🔍 What is a P-value?
A P-value helps you determine whether your results are statistically significant.
In simple terms:
It tells you how likely your observed results would occur if the null hypothesis were true.
📌 Interpretation
- p < 0.01 → Strong evidence against the null hypothesis
- p < 0.05 → Moderate evidence against the null hypothesis
- p > 0.05 → Weak or no evidence against the null hypothesis
👉 Example:
If you test whether a new teaching method improves scores and get p = 0.03, you can conclude the improvement is statistically significant at the 5% level.
🧠 Parametric vs Non-Parametric Tests
Before choosing a test, you need to understand this fundamental distinction:
✅ Parametric Tests
- Assume data follows a normal distribution
- Use means and standard deviations
- More powerful when assumptions are met
Examples:
- t-test
- ANOVA
- Pearson correlation coefficient
⚠️ Non-Parametric Tests
- No assumption of normal distribution
- Use ranks or medians
- Better for skewed or ordinal data
Examples:
- Mann-Whitney U test
- Kruskal-Wallis test
- Spearman rank correlation
📘 Types of Statistical Tests (With Real Examples)
Let’s go through each category from your infographic with deeper explanations.
1️⃣ Comparing One Group
✔️ One-sample t-test
Used when comparing a sample mean to a known value.
Example:
Is the average salary in your company different from $50,000?
2️⃣ Comparing Two Groups
✔️ Independent t-test
Used when comparing two unrelated groups.
Example:
Do male and female students perform differently in exams?
✔️ Paired t-test
Used when comparing the same group at different times.
Example:
Weight before and after a fitness program.
3️⃣ Comparing More Than Two Groups
✔️ One-way ANOVA
Used when comparing 3 or more groups.
Example:
Which teaching method leads to better performance across 3 classrooms?
4️⃣ Working with Categorical Data
✔️ Chi-square test of independence
Tests whether two categorical variables are related.
Example:
Is gender associated with product preference?
✔️ Chi-square goodness of fit test
Checks if observed data matches expected distribution.
Example:
Do survey responses match expected proportions?
5️⃣ Measuring Relationships
✔️ Pearson correlation coefficient
Measures linear relationship between two continuous variables.
Example:
Height vs weight
✔️ Spearman rank correlation
Used for ordinal or non-normal data.
Example:
Rank in class vs satisfaction level
6️⃣ Non-Parametric Alternatives
When your data is skewed or ordinal, use these:
✔️ Mann-Whitney U test
Alternative to independent t-test
Example: Customer satisfaction across two stores
✔️ Wilcoxon signed-rank test
Alternative to paired t-test
Example: Pain levels before and after treatment
✔️ Kruskal-Wallis test
Alternative to ANOVA
Example: Income differences across regions
✔️ Friedman test
Alternative for repeated measures ANOVA
Example: Ranking products by same users
⚡ How to Choose the Right Statistical Test
Here’s a simple decision-making framework:
🧩 Step 1: Identify Your Goal
- Compare means → t-test / ANOVA
- Find relationships → correlation
- Analyze proportions → Chi-square
🧩 Step 2: Count Variables
- 1 variable → One-sample test
- 2 variables → t-test / correlation
- 3+ groups → ANOVA
🧩 Step 3: Check Data Type
- Nominal → Chi-square
- Ordinal → Non-parametric tests
- Scale → Parametric tests
🧩 Step 4: Check Data Distribution
- Normal → Parametric
- Not normal → Non-parametric
| Test Name | Type | No. of Variables | Measurement Scale (First Variable and / or Second Variable) | Example |
|---|---|---|---|---|
| One-sample t-test | Parametric | One | Interval/Ratio | Testing if the average salary differs from $50,000 |
| Independent t-test | Parametric | Two (independent) | Nominal (groups) + Scale | Comparing exam scores of male vs female students |
| Paired t-test | Parametric | Two (paired) | Scale | Measuring weight before and after a diet program |
| One-way ANOVA | Parametric | One IV, One DV | Nominal (3+ groups) + Scale | Comparing test scores across 3 different teaching methods |
| Chi-square goodness of fit test | Non-parametric | One | Nominal | Checking if observed brand preferences match expected proportions |
| Chi-square test of independence | Non-parametric | Two | Nominal | Examining if gender is related to product choice |
| Pearson correlation coefficient | Parametric | Two | Scale | Relationship between height and weight |
| Spearman rank correlation | Non-parametric | Two | Ordinal | Correlation between class rank and satisfaction level |
| Mann-Whitney U test | Non-parametric | Two (independent) | Ordinal/Scale | Comparing customer satisfaction between two stores |
| Wilcoxon signed-rank test | Non-parametric | Two (paired) | Ordinal/Scale | Before-after pain scores in patients |
| Kruskal-Wallis test | Non-parametric | 3+ groups | Ordinal/Scale | Comparing income levels across 4 regions (non-normal data) |
| Friedman test | Non-parametric | 3+ related groups | Ordinal/Scale | Ranking 3 different products by the same participants |
💡 Common Mistakes to Avoid
- ❌ Using parametric tests on non-normal data
- ❌ Ignoring measurement scale
- ❌ Confusing independent vs paired samples
- ❌ Over-relying on p-value without effect size
🧾 Final Thoughts
Choosing the right statistical test doesn’t have to be complicated.
If you remember just three things:
- Type of data matters most
- Number of groups determines the test
- Distribution decides parametric vs non-parametric
👉 With these basics, you can confidently select the correct test for most real-world scenarios.


Leave a comment