
1. Introduction
Sample design is a critical step in primary research that ensures data collected is representative, reliable, and statistically valid. Whether you’re conducting market research, social science studies, or product testing, a well-designed sample is crucial for collecting reliable data. For example, in agricultural studies, proper sampling helps in generalizing findings to a larger farming population. This article walks you through the essential steps to create an effective sampling plan for any research project.
Why Sample Design Matters
A good sample design ensures:
✔ Your findings accurately represent the larger population
✔ You avoid biased or misleading results
✔ Your research stays within budget and time constraints
✔ Your conclusions have statistical validity
Poor sampling can lead to wasted resources and unreliable conclusions that don’t hold up to scrutiny.
2. Key Steps and Components of Sample Design
Step 1. Define the Target Population
- Who are the respondents? (e.g., smallholder farmers, commercial farmers, agri-business owners)
- Geographical coverage (e.g., specific district, state, or agro-climatic zone)
- Inclusion/Exclusion Criteria (e.g., farmers using hybrid seeds, those with >2 acres of land)
Step 2. Sampling Frame
- A list of all potential sampling units (e.g., farmer registries, cooperative society lists, government agriculture department records).
- If no complete list exists, cluster or area sampling may be used.
Step 3. Choose Your Sampling Method
Probability Sampling (Best for Quantitative Research)
- Simple Random Sampling
- Every member has equal chance of selection
- Best when you have a complete sampling frame
- Example: Drawing names from a hat
- Stratified Sampling
- Divide population into subgroups (strata), then sample from each
- Ensures representation of key segments
- Example: Sampling equal numbers of men and women
- Cluster Sampling
- Randomly select groups (clusters), then sample all within them
- Cost-effective for geographically dispersed populations
- Example: Selecting certain schools to survey all students
- Systematic Sampling
- Select every nth member from a list
- Example: Surveying every 10th customer who enters a store
Non-Probability Sampling (For Qualitative or Exploratory Research)
- Convenience Sampling
- Using readily available participants
- Quick but potentially biased
- Purposive Sampling
- Selecting specific individuals who meet criteria
- Common for expert interviews
- Snowball Sampling
- Participants refer others
- Useful for hard-to-reach populations
Choose a method based on research objectives, budget, and data precision needs:
| Sampling Method | When to Use | Pros & Cons |
|---|---|---|
| 1. Simple Random Sampling | When the population is homogeneous | ✅ Unbiased, easy to analyze ❌ Needs complete sampling frame |
| 2. Stratified Sampling | If population has distinct subgroups (e.g., small vs. large farmers) | ✅ Ensures representation ❌ Complex analysis |
| 3. Cluster Sampling | When population is spread over large areas (e.g., villages as clusters) | ✅ Cost-effective ❌ Higher sampling error |
| 4. Systematic Sampling | When a sampling frame is available (e.g., every 10th farmer on a list) | ✅ Simple to implement ❌ Risk of bias if patterns exist |
| 5. Purposive Sampling | For qualitative studies (selecting experts or specific cases) | ✅ Targeted insights ❌ Not statistically generalizable |
Step 4. Sample Size Determination
Use statistical formulas or rules of thumb:
- For quantitative studies:
- Use Cochran’s formula:
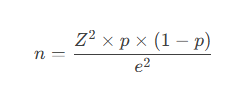
- Where:
- Z = Z-score (1.96 for 95% confidence)
- p = Estimated proportion (0.5 for max variability)
- e = Margin of error (e.g., 5%)
- Example: For a 95% confidence level and 5% margin of error, minimum sample = 384.
- For qualitative studies:
- Sample until you reach “theoretical saturation” (no new insights emerge), typically:
- 15-30 in-depth interviews
- 3-6 focus groups
Step 5. Data Collection Plan
- Survey method: Face-to-face interviews, phone surveys, online forms.
- Sampling interval: If systematic, decide the interval (e.g., every 5th farmer).
- Replacement strategy: How to handle non-responses (e.g., next farmer in the list).
Step 6. Implement Quality Controls
Avoid these common sampling errors:
- Coverage Error – Your sampling frame doesn’t match population
Solution: Use multiple source lists - Non-response Bias – Certain groups don’t participate
Solution: Follow-up contacts, incentives - Selection Bias – Sample isn’t truly random
Solution: Use proper randomization methods - Measurement Error – Questions are misunderstood
Solution: Pre-test your survey instrument
Step 7: Execute and Monitor
- Create clear protocols for data collectors
- Track response rates daily
- Be prepared to supplement your sample if needed
- Document all sampling decisions for your methodology section
3. Example: Sample Design for a Study on Fertilizer Adoption and Customer Satisfaction Survey
Example 1
- Population: 10,000 farmers in District X
- Sampling Method: Stratified (by farm size: small, medium, large)
- Sample Size: 400 (calculated via Cochran’s formula)
- Breakdown:
- Small farmers (≤2 acres): 200
- Medium farmers (2-5 acres): 150
- Large farmers (>5 acres): 50
Example 2
- Population: All premium subscribers of a streaming service
- Sampling Method: Stratified random sample by subscription length
- Sample Size: 400 (200 short-term subscribers, 200 long-term)
- Data Collection: Online survey with email invitations
4. Potential Errors & Mitigation
| Error Type | How to Minimize |
|---|---|
| Sampling Bias | Use random selection, avoid convenience sampling |
| Non-Response Bias | Follow up with respondents, use replacements |
| Measurement Error | Train enumerators, pre-test questionnaires |
5. Conclusion
A well-designed sample ensures reliable, cost-effective, and actionable insights. Always:
✔ Define the population clearly
✔ Choose the right sampling method
✔ Calculate an appropriate sample size
✔ Plan for data collection logistics
Key Takeaways
- Start with a crystal-clear definition of your target population
- Match your sampling method to your research goals and resources
- Calculate sample size properly – don’t just guess
- Build in safeguards against common sampling errors
- Document every step for methodological transparency
Remember: Good sampling is both a science and an art. While statistical principles provide the foundation, real-world constraints often require practical adaptations.


Leave a comment