
In today’s competitive and data-driven world, business research relies heavily on data analysis to uncover insights, test hypotheses, and inform strategic decisions. But data analysis isn’t just about running statistical tests — it’s a structured process involving multiple stages, each crucial for turning raw data into actionable intelligence.
In business research, data analysis transforms raw information into actionable insights that drive strategic decisions. Whether you’re a management student, an analyst, or a researcher, or you’re conducting market research, customer behavior analysis, or operational performance evaluation, understanding the stages of data analysis is key to producing reliable, meaningful and impactful research outcomes.
🔍 Stage 1: Problem Definition and Research Design
Before diving into data, you need a clear roadmap. This stage involves:
- Defining the business problem: What decision needs to be made?
- Formulating research questions or hypotheses.
- Choosing the type of research: Exploratory, descriptive, or causal.
- Deciding on the data sources: Primary (surveys, interviews) or secondary (databases, reports).
🎯 Tip: A well-defined problem leads to a well-structured analysis.
Example: A retail company wants to understand why customer retention rates are declining in Q2.
📥 Stage 2: Data Collection
Once you know what you’re looking for, the next step is to gather relevant and high-quality data for analysis.
- Primary Data: Collected directly from respondents (surveys, observations, focus groups).
- Secondary Data: From existing sources like market reports, company records, or public datasets.
- Tools: Google Forms, Qualtrics, SPSS Data Entry, APIs, web scraping.
⚠️ Beware: Poor data collection leads to garbage in, garbage out (GIGO).
Data Sources:
| Type | Examples |
|---|---|
| Primary Data | Surveys, interviews, focus groups, experiments |
| Secondary Data | Industry reports, government data, competitor analysis |
| Internal Data | CRM records, sales transactions, web analytics |
| External Data | Social media, market research firms, public datasets |
Best Practices:
✔ Ensure data relevance to research questions
✔ Maintain data quality standards
✔ Document collection methods for reproducibility
🧹 Stage 3: Data Cleaning and Preparation
Raw data is rarely clean. Before analysis, data needs to be:
- Validated: Check for consistency and completeness.
- Cleansed: Remove duplicates, correct errors, handle missing values.
- Formatted: Transform variables into usable formats (e.g., dates, categories).
- Coded: Convert categorical responses into numerical codes for analysis.
The purpose of this stage is to transform raw data into an analyzable format
Key Steps:
- Data Integration – Combine datasets from multiple sources
- Handling Missing Data – Impute or remove incomplete records
- Outlier Detection – Identify and address anomalies
- Standardization – Consistent formats for dates, currencies, etc.
- Feature Engineering – Create new meaningful variables
🛠️ Tools: Excel, R, Python (Pandas), Power Query, SPSS.
🗂️ Stage 4: Exploratory Data Analysis (EDA)
This stage helps you understand the structure and patterns in the data.
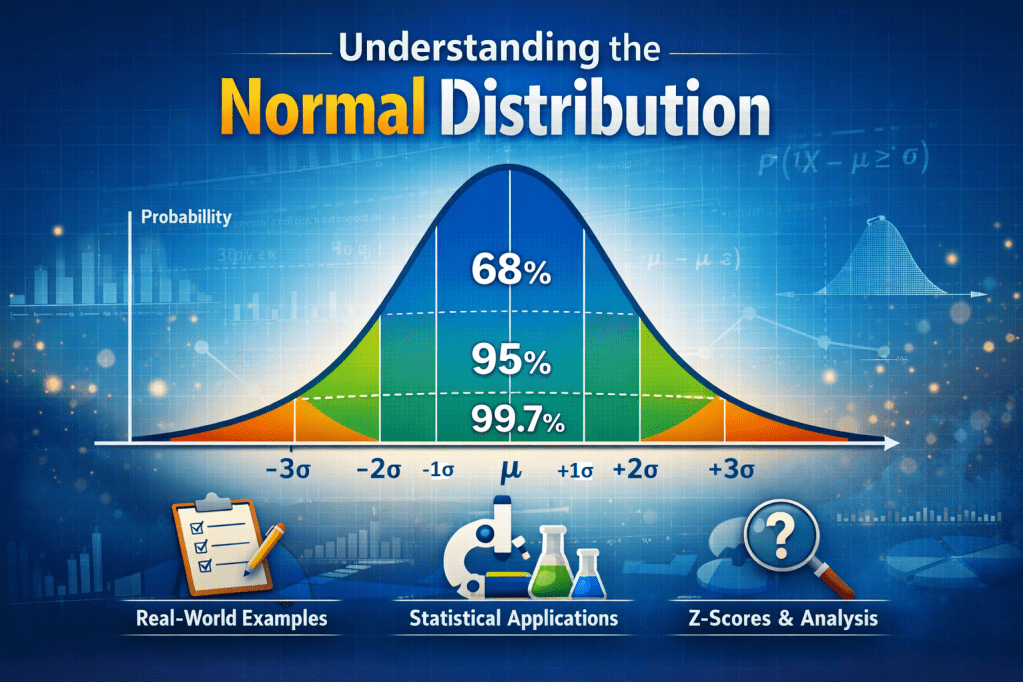
- Descriptive Statistics: Mean, median, mode, standard deviation.
- Frequency Analysis: Count and percentage distributions.
- Visualization: Histograms, box plots, bar charts, scatter plots.
- Correlation analysis
- Segment comparison
🎨 Why it matters: EDA reveals outliers, trends, and hidden patterns that guide deeper analysis.
Business Application: A marketing team discovers through EDA that customers aged 25-34 have the highest churn rates.
🧠 Stage 5: Statistical Analysis and Hypothesis Testing
This is where the real analysis begins.
- Inferential Statistics: T-tests, ANOVA, Chi-square tests, regression models.
- Multivariate Analysis: Factor analysis, cluster analysis, discriminant analysis.
- Predictive Analytics: Linear/logistic regression, decision trees, machine learning models.
Quantitative Methods:
| Method | Business Use Case |
|---|---|
| Regression Analysis | Predicting sales based on ad spend |
| Cluster Analysis | Customer segmentation |
| Time Series Analysis | Demand forecasting |
| Factor Analysis | Identifying key satisfaction drivers |
Qualitative Methods:
- Thematic analysis of customer feedback
- Sentiment analysis of social media data
- Content analysis of interview transcripts
📊 Purpose: Test hypotheses, Derive deeper insights, validate relationships, and make predictions.
📈 Stage 6: Interpretation and validation of Results
Numbers alone don’t tell a story — interpreting them does. Ensure findings are accurate and meaningful.
- What do the results mean?
- Are the results statistically and practically significant?
- Do they support or reject the hypotheses?
- What are the implications for business decisions?
Validation Techniques:
- Statistical significance testing
- Cross-validation of models
- Peer review of results
- Comparison with industry benchmarks
🧭 Think like a decision-maker: Link findings back to the original problem.
Red Flag: A correlation doesn’t always imply causation – validate with experiments when possible.
📑 Stage 7: Reporting and Visualization
The final results must be presented in a clear and compelling way.
- Dashboards: Use tools like Tableau, Power BI, or Google Data Studio.
- Reports: Include executive summaries, visuals, and narratives.
- Presentations: Tell a story using data, not just charts.
Effective Business Visualizations:
- Executive Dashboards (KPIs, trends)
- Comparative Charts (YoY performance)
- Geographic Maps (Regional sales)
- Predictive Model Outputs (Forecast scenarios)
🗣️ Remember: Great insights are wasted if poorly communicated.
🔁 Bonus Stage: Validation and Feedback
After the report is out, good researchers:
- Seek feedback from stakeholders.
- Validate findings with further data or new samples.
- Refine models for better accuracy.
This fosters a continuous improvement loop in research quality.
⚙️Decision Implementation
Purpose: Translate insights into business actions.
Implementation Framework:
- Prioritize findings by potential impact
- Develop action plans with responsible teams
- Set measurable objectives
- Establish monitoring systems
Case Example: An e-commerce company implements personalized recommendations based on clustering analysis, increasing conversions by 18%.
🧭Performance Monitoring
Purpose: Track the impact of data-driven decisions.
Metrics to Monitor:
- Key Performance Indicators (KPIs)
- Return on Analytics Investment (ROAI)
- Model accuracy over time
- Business outcome improvements
Business Research Analysis Checklist
| Stage | Key Questions |
|---|---|
| Planning | Are research objectives aligned with business needs? |
| Data Collection | Is the data representative and unbiased? |
| Cleaning | Have all data quality issues been addressed? |
| Analysis | Are the methods appropriate for the research questions? |
| Interpretation | Are conclusions supported by evidence? |
| Reporting | Are insights communicated clearly to stakeholders? |
| Implementation | Are findings being used to drive decisions? |
Emerging Trends in Business Research Analysis
- Automated Machine Learning (AutoML) – Faster model development
- Natural Language Processing – Analyzing unstructured feedback at scale
- Real-time Analytics – Instant insights for agile decision-making
- Ethical AI – Ensuring fair, unbiased analyses
🧩 Conclusion: Data Analysis is a Journey, Not Just a Task
Each stage in data analysis is like a piece of a puzzle. Skipping one can break the entire picture. By following a structured process — from problem formulation to insightful reporting — you ensure that your business research is robust, reliable, and relevant.
Effective data analysis in business research follows a systematic approach from problem definition to implementation. By meticulously progressing through these nine stages, organizations can:
✔ Make evidence-based decisions
✔ Identify new opportunities
✔ Optimize operations
✔ Gain competitive advantages
Pro Tip: Document each stage thoroughly – this creates an auditable process and enables continuous improvement in your research capabilities.
In an era where data is the new oil, mastering these stages empowers you to drive evidence-based decisions and generate real business value.


Leave a comment