

🌟 Introduction
When comparing two sample means, we use the t-test. In data analytics and statistics, we often encounter situations where we need to compare more than two groups.
For example:
- Do different fertilizers produce significantly different crop yields?
- Does the mean income differ across three regions?
- Do students from three schools perform differently on average?
In such cases, instead of doing multiple t-tests (which increases error chances), we use ANOVA (Analysis of Variance) — a powerful statistical method that tells whether group means are significantly different. The underlying statistic used in ANOVA is the F-test.
🎯 What is ANOVA?
ANOVA (Analysis of Variance) compares the variances between groups and within groups to determine if at least one group mean differs from the others.
In simple terms:
ANOVA helps determine whether the observed differences among sample means are due to real differences or just random chance.
It works by partitioning total variability in the data into:
- Between-group variance — differences among group means.
- Within-group variance — random differences inside each group.
If between-group variance is large compared to within-group variance, it suggests that group means are not equal.
🧩 The Logic Behind ANOVA
ANOVA divides the total variation observed in the data into:
- Between-group variation (SSB): Variation due to the difference between group means.
- Within-group variation (SSW): Variation due to differences within each group (random error).
The ratio of these two gives the F-statistic:

If this F-ratio is large, it suggests that group means differ significantly.
| Source of Variation | Meaning | Measure |
|---|---|---|
| Between Groups | Variation due to treatment or differences in group means | SSB = Sum of Squares Between Groups |
| Within Groups | Variation within each group (random error) | SSW = Sum of Squares Within Groups |
| Total | Combined variation of all data | SST = Total Sum of Squares |
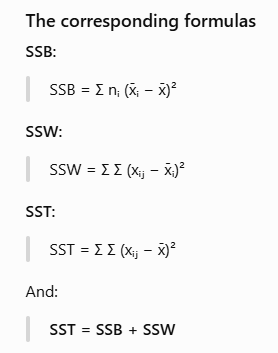
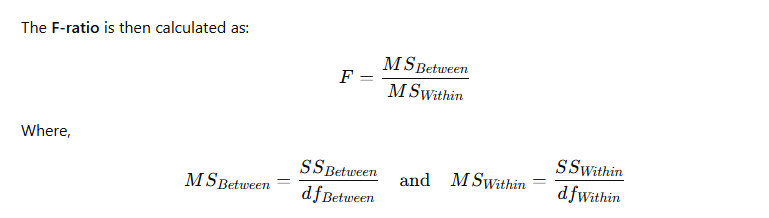
If F calculated > F critical (from F-distribution table), we reject H₀, meaning at least one mean differs.
🧮 ANOVA Terminology
| Term | Full Form | Interpretation |
|---|---|---|
| SS | Sum of Squares | Measure of variation |
| MS | Mean Square | Average variation (SS / df) |
| df | Degrees of Freedom | Number of independent values |
| F | F-ratio | Ratio of two variances |
⚙️ Types of ANOVA
| Type | Description | Example |
|---|---|---|
| One-Way ANOVA | Compares means across one categorical independent variable | Comparing average yield under three fertilizers |
| Two-Way ANOVA | Compares means across two categorical independent variables | Comparing yield by fertilizer type and irrigation level |
| MANOVA (Multivariate ANOVA) | Used when there are multiple dependent variables | Comparing performance scores on multiple subjects across schools |
⚖️ Hypotheses in ANOVA
- Null Hypothesis (H₀): All group means are equal
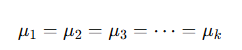
- Alternative Hypothesis (H₁): At least one mean differs
⚖️ Assumptions of ANOVA
- Normality – Data within each group should be normally distributed.
- Homogeneity of variance – Variances across groups should be similar.
- Independence – Observations should be independent of each other.
💡 Real-World Applications
- Agriculture: Comparing crop yields under different fertilizers
- Business: Evaluating sales performance across regions
- Education: Testing student performance across teaching methods
- Healthcare: Comparing effects of different drugs or treatments
🧠 Understanding the F-Test
The F-test is the core of ANOVA — it compares variances to test hypotheses about group means.
Formula:

It’s also used independently in:
- Testing equality of variances
- Comparing regression models
- Performing ANOVA
🔹 Example: Basic F-Test
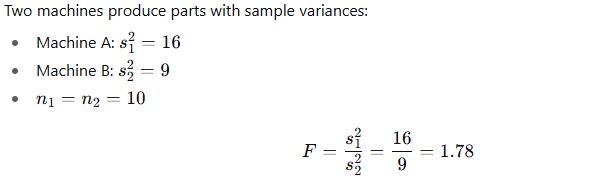
At 0.05 level with df₁ = 9 and df₂ = 9, critical F = 3.18.
Since 1.78 < 3.18, we accept H₀ → variances are not significantly different.
📈 Interpreting Results
| F Value | Decision | Interpretation |
|---|---|---|
| F < 1 | Accept H₀ | No significant difference |
| F ≈ 1 | Accept H₀ | Groups are similar |
| F >> 1 | Reject H₀ | Significant difference among groups |
📘 Example 1: One-Way ANOVA
Scenario:
A researcher wants to test if three fertilizers (A, B, C) have different effects on crop yield.
| Fertilizer | Yields (kg/acre) |
|---|---|
| A | 40, 42, 38, 41 |
| B | 45, 47, 46, 44 |
| C | 39, 40, 42, 41 |
Step 1: Define Hypotheses
- H₀: μA = μB = μC
- H₁: At least one mean differs
Step 2: Calculate Group Means and Overall Mean
| Group | Data | Mean |
|---|---|---|
| A | 40, 42, 38, 41 | 40.25 |
| B | 45, 47, 46, 44 | 45.5 |
| C | 39, 40, 42, 41 | 40.5 |
Overall Mean (Grand Mean) = (Sum of all values) / (Total N)

Step 3: Compute Sum of Squares
(a) Between Groups (SSB):
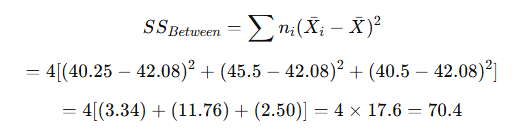
(b) Within Groups (SSW):
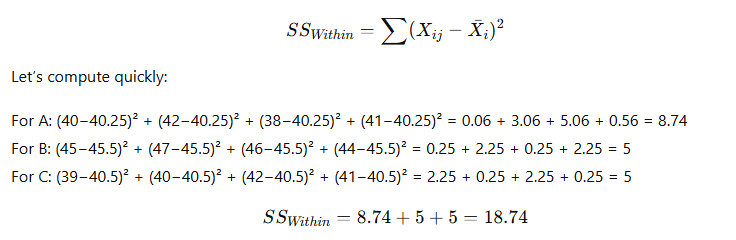
(c) Total:

Step 4: Calculate Degrees of Freedom
- df₁ (Between) = k − 1 = 3 − 1 = 2
- df₂ (Within) = N − k = 12 − 3 = 9
Step 5: Compute Mean Squares

Step 6: Compute F-Ratio
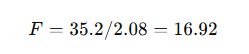
Step 7: Compare with Critical F
At α = 0.05, df₁=2, df₂=9 → F-critical ≈ 4.26
Since 16.92 > 4.26, we reject H₀.
✅ Conclusion: There is a significant difference in yields among the fertilizers.
📘 Example 2: One-Way ANOVA
A researcher wants to know whether three fertilizers (A, B, and C) produce significantly different yields (in kg). The results are:
| Fertilizer | Sample Yields |
|---|---|
| A | 20, 22, 19 |
| B | 25, 27, 23 |
| C | 28, 30, 27 |
Step 1: State the Hypotheses
- H₀: μA = μB = μC (no difference in mean yield)
- H₁: At least one mean is different
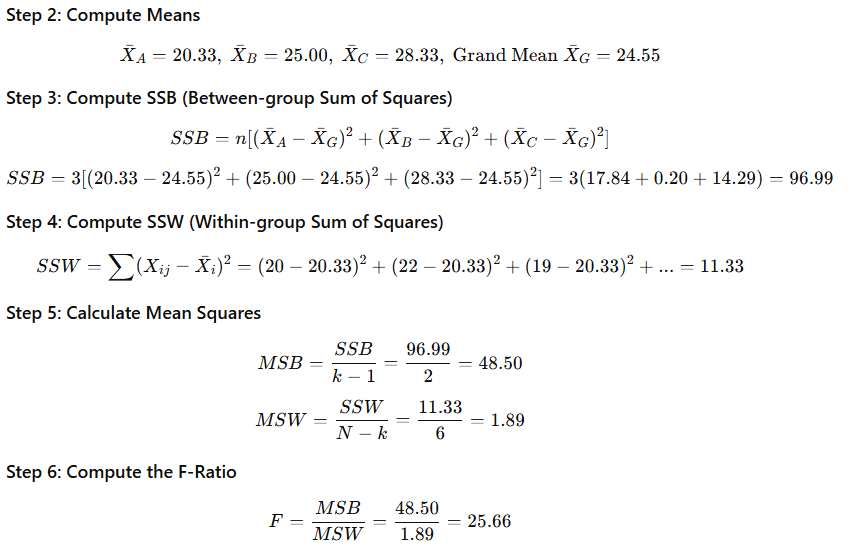
Step 7: Decision
For df₁ = 2 and df₂ = 6, the critical F-value at 0.05 significance = 5.14.
Since 25.66 > 5.14, we reject H₀ — fertilizer types significantly affect yield.
📗 Example 2: F-Test for Comparing Two Variances
Scenario:
Two machines produce ball bearings. We want to test if their output variances differ.
| Machine | Sample Variance (s²) | n |
|---|---|---|
| A | 2.5 | 10 |
| B | 1.2 | 12 |
Step 1:
H₀: σ₁² = σ₂²
H₁: σ₁² ≠ σ₂²
Step 2:
F = s₁² / s₂² = 2.5 / 1.2 = 2.08
Step 3:
df₁ = 9, df₂ = 11
F-critical (α = 0.05) ≈ 3.29
Since 2.08 < 3.29 → Fail to reject H₀
✅ Conclusion: The variances of the two machines are not significantly different.
📈 When to Use ANOVA vs F-Test
| Test | Used For | Example |
|---|---|---|
| F-Test | Compare two variances | Compare variances of two production machines |
| One-Way ANOVA | Compare 3+ group means (one factor) | Compare yields from 3 fertilizers |
| Two-Way ANOVA | Compare 3+ groups considering 2 factors | Compare yields across fertilizers and soil types |
🧠 Key Insights
- A large F-value → greater difference between group means.
- If p-value < 0.05 → reject H₀ (significant difference).
- Post-hoc tests (Tukey, Bonferroni) can be applied after ANOVA to identify which groups differ.
⚙️ Tools for ANOVA and F-Test
- Excel:
=ANOVA.SINGLEor Data Analysis Toolpak - Python:
scipy.stats.f_oneway() - R:
aov()orsummary(aov(...)) - SPSS / Minitab: Built-in menus for One-Way and Two-Way ANOVA
🧾 Summary Table
| Aspect | ANOVA | F-Test |
|---|---|---|
| Purpose | Compare means | Compare variances |
| Data type | Ratio/interval | Ratio/interval |
| Groups | ≥ 3 | 2 |
| Test statistic | F-ratio | F-ratio |
| Follows | F-distribution | F-distribution |
📚 Further Reading
- Applied Statistics and Probability for Engineers – Montgomery & Runger
- Statistics for Business and Economics – Newbold et al.
- Khan Academy: ANOVA
- Scipy Documentation – ANOVA
- Practical Statistics for Data Scientists – Bruce & Bruce
- Montgomery, D. C. (2019). Design and Analysis of Experiments. Wiley.
- Gujarati, D. N. (2020). Basic Econometrics. McGraw-Hill Education.
- Statistics by Jim: ANOVA Simplified. statisticsbyjim.com
- NIST e-Handbook of Statistical Methods – https://www.itl.nist.gov/div898/handbook/








Leave a Reply