
Introduction
A digital marketing campaign should not be evaluated only by the number of clicks, leads or immediate purchases it generates.
Consider two customers:
Customer A
- Acquisition cost = ₹800
- First purchase = ₹1,000
- Never purchases again
Customer B
- Acquisition cost = ₹800
- First purchase = ₹1,000
- Makes several additional purchases over three years
Looking only at the first transaction, the customers may appear similar.
From a long-term business perspective, however, their economic value can be very different.
This is why advanced digital marketing analytics focuses on:
- Customer lifetime value
- Retention
- Repeat purchases
- Churn
- Attribution
- Cohort analysis
- Marketing dashboards
- Predictive analytics
- Prescriptive analytics
1. Customer Lifetime Value (CLV)
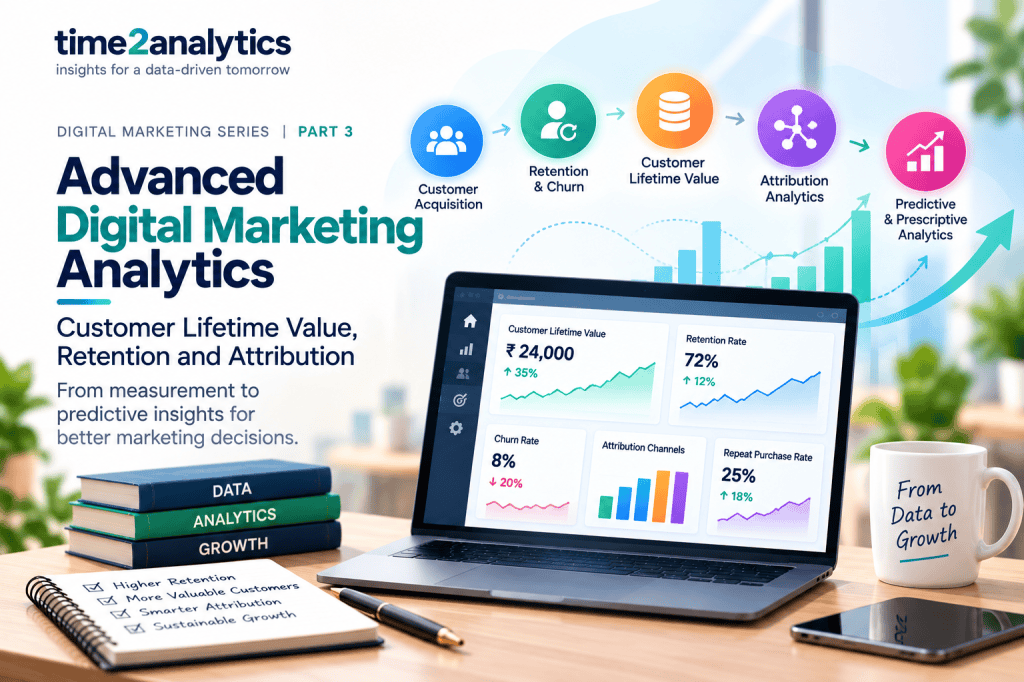
Customer Lifetime Value estimates the value generated by a customer during the relationship with an organization.
A simplified model is:
Formula
CLV = Average Purchase Value × Purchase Frequency × Customer Lifespan
Example
Average purchase value = ₹2,000
Purchases per year = 4
Customer lifespan = 3 years
CLV = ₹2,000 × 4 × 3
CLV = ₹24,000
The estimated customer lifetime value is ₹24,000 under this simplified model.
More sophisticated CLV models can incorporate:
- Gross margin
- Retention probability
- Discount rates
- Churn probability
- Customer-specific behavior
2. Customer Retention Rate
Retention measures the proportion of customers retained over a specified period.
A common formula is:
Retention Rate (%) = [(Customers at End − New Customers Acquired) ÷ Customers at Start] × 100
Example
Customers at beginning = 10,000
Customers at end = 9,000
New customers acquired = 2,000
Therefore:
Retention Rate = [(9,000 − 2,000) ÷ 10,000] × 100
Retention Rate = 70%
3. Churn Rate
Churn measures the proportion of customers lost during a specified period.
A simplified formula is:
Churn Rate (%) = Customers Lost ÷ Customers at Start × 100
If a company starts with 10,000 customers and loses 1,000:
Churn Rate = (1,000 ÷ 10,000) × 100
Churn Rate = 10%
Retention and churn should normally be analyzed together.
4. Repeat Purchase Rate
Repeat purchase rate measures how many customers make more than one purchase.
Formula
Repeat Purchase Rate (%) = Repeat Customers ÷ Total Customers × 100
Example
Total customers = 10,000
Repeat customers = 2,500
Repeat Purchase Rate = (2,500 ÷ 10,000) × 100
Repeat Purchase Rate = 25%
This metric is particularly important for ecommerce and subscription-oriented businesses.
5. Customer Acquisition Cost vs Customer Lifetime Value
CAC and CLV become particularly informative when examined together.
Suppose:
CAC = ₹1,000
CLV = ₹10,000
The customer relationship has substantially greater estimated value than the initial acquisition cost under this simplified calculation.
However, marketers should not blindly assume that a high CLV automatically justifies any acquisition expenditure. Margin, cash flow, retention uncertainty and attribution should also be considered.
6. Attribution Analytics
A customer may interact with multiple marketing channels before making a purchase.
For example:
Instagram → Google Search → Website → Email → Purchase
Which channel generated the conversion?
This is the attribution problem.
Common attribution approaches include:
First-touch attribution
Credit is assigned to the first interaction.
Last-touch attribution
Credit is assigned to the final interaction.
Linear attribution
Credit is distributed across multiple interactions.
Data-driven attribution
Credit allocation is informed by observed customer journey data and statistical modelling.
The choice of attribution methodology can influence how marketing performance is interpreted.
7. Cohort Analysis
Cohort analysis groups customers based on a common characteristic, usually the time or source of acquisition.
For example:
| Cohort | Customers | Month 1 Retention | Month 3 Retention |
|---|---|---|---|
| January | 1,000 | 70% | 45% |
| February | 1,200 | 75% | 50% |
| March | 1,500 | 78% | 55% |
This allows marketers to examine whether customer quality is improving across acquisition periods.
8. Vanity Metrics vs Actionable Metrics
A vanity metric may look impressive without directly explaining business performance.
Examples:
- Followers
- Likes
- Total impressions
- Total views
Actionable metrics include:
- CAC
- Conversion rate
- ROAS
- CLV
- Retention
- Repeat purchase rate
For example:
A brand may have 500,000 followers but generate relatively few customers.
Another brand may have 50,000 followers but generate significantly more revenue.
Therefore:
Audience size is not the same as business value.
9. Digital Marketing Dashboards
A marketing dashboard should connect marketing activity with business outcomes.
A practical dashboard can contain:
Acquisition
- Users
- Sessions
- Reach
- Impressions
- CPC
- CPM
Engagement
- CTR
- Engagement rate
- Engaged sessions
- Watch time
Conversion
- Leads
- Purchases
- Conversion rate
- CPL
- CPA
Financial
- Revenue
- CAC
- AOV
- ROAS
- ROI
Customer
- Retention
- Churn
- Repeat purchase
- CLV
10. From Descriptive to Prescriptive Analytics
Digital marketing analytics can be understood as a progression.
Descriptive Analytics
What happened?
Example:
Website traffic increased by 25%.
Diagnostic Analytics
Why did it happen?
Example:
Organic traffic increased because search visibility improved for several high-volume keywords.
Predictive Analytics
What is likely to happen?
Example:
Customers with a particular behavioral pattern have a higher predicted probability of purchasing.
Prescriptive Analytics
What action should be considered?
Example:
Prioritize advertising toward customer segments with higher predicted conversion and lifetime value.
This progression is particularly relevant to an analytics-focused publication such as Time2Analytics.
11. AI in Digital Marketing Analytics
Artificial intelligence can be used to support:
- Customer segmentation
- Recommendation systems
- Lead scoring
- Churn prediction
- Sentiment analysis
- CLV prediction
- Campaign optimization
- Personalization
- Marketing attribution
- Content analysis
For example, a predictive model could estimate the probability that a customer will purchase within the next 30 days.
Customers could then be segmented into:
- High purchase probability
- Medium purchase probability
- Low purchase probability
Marketing teams can use these predictions to support campaign planning.
12. From Analytics to Decision-Making
The ultimate purpose of marketing analytics is not to produce dashboards.
It is to improve decisions.
Consider this situation:
Campaign A
- CPC = ₹4
- Conversion Rate = 1%
- CAC = ₹800
Campaign B
- CPC = ₹8
- Conversion Rate = 4%
- CAC = ₹200
Campaign B has a higher CPC but a lower customer acquisition cost because it converts visitors more effectively.
This illustrates why metrics should be evaluated together rather than independently.
13. The Digital Marketing Analytics Chain
The complete measurement framework can be represented as:
Reach
↓
Engagement
↓
Traffic
↓
Conversion
↓
Revenue
↓
Retention
↓
Customer Lifetime Value
This framework helps organizations move from basic campaign reporting to strategic marketing analytics.
14. Key Takeaways
| Analytical Area | Important Metrics |
|---|---|
| Awareness | Reach, impressions, CPM |
| Engagement | CTR, engagement rate, watch time |
| Acquisition | CPC, CPL, CAC |
| Conversion | Conversion rate, CPA |
| Revenue | Revenue, AOV, ROAS, ROI |
| Retention | Retention rate, churn |
| Customer value | CLV, repeat purchase |
| Attribution | First-touch, last-touch, data-driven |
| Advanced analytics | Cohort analysis, predictive modelling, AI |
Conclusion
Digital marketing measurement should evolve from simple activity reporting toward customer and business-value analysis.
The progression is:
“How many people saw our campaign?”
to
“How many interacted?”
to
“How many converted?”
to
“How much revenue did we generate?”
and finally:
“What long-term value did those customers create?”
This is the real purpose of digital marketing analytics.
When organizations connect acquisition, engagement, conversion, revenue and customer lifetime value, digital marketing becomes more than a collection of online promotional activities. It becomes a data-driven decision system.
For analytics professionals, the most important shift is therefore from counting metrics to interpreting relationships among metrics.
References
- Google Analytics Help. About Events and Key Events. Google.
- Google Analytics Help. Attribution and Conversion Measurement. Google.
- DataReportal. Digital 2026: Global Overview Report.
- Chaffey, D. & Ellis-Chadwick, F. Digital Marketing: Strategy, Implementation and Practice. Pearson.
- Kotler, P., Keller, K. L. & Chernev, A. Marketing Management. Pearson.
- Farris, P. W., Bendle, N. T., Pfeifer, P. E. & Reibstein, D. J. Marketing Metrics: The Manager’s Guide to Measuring Marketing Performance. Pearson.






Leave a comment