
Introduction
Getting people to see an advertisement or visit a website is only the beginning of digital marketing.
The more important question is:
What did visitors actually do after arriving?
Did they:
- Submit a form?
- Register?
- Request a quotation?
- Add a product to the cart?
- Complete a purchase?
- Download a document?
- Book an appointment?
These actions are called conversions.
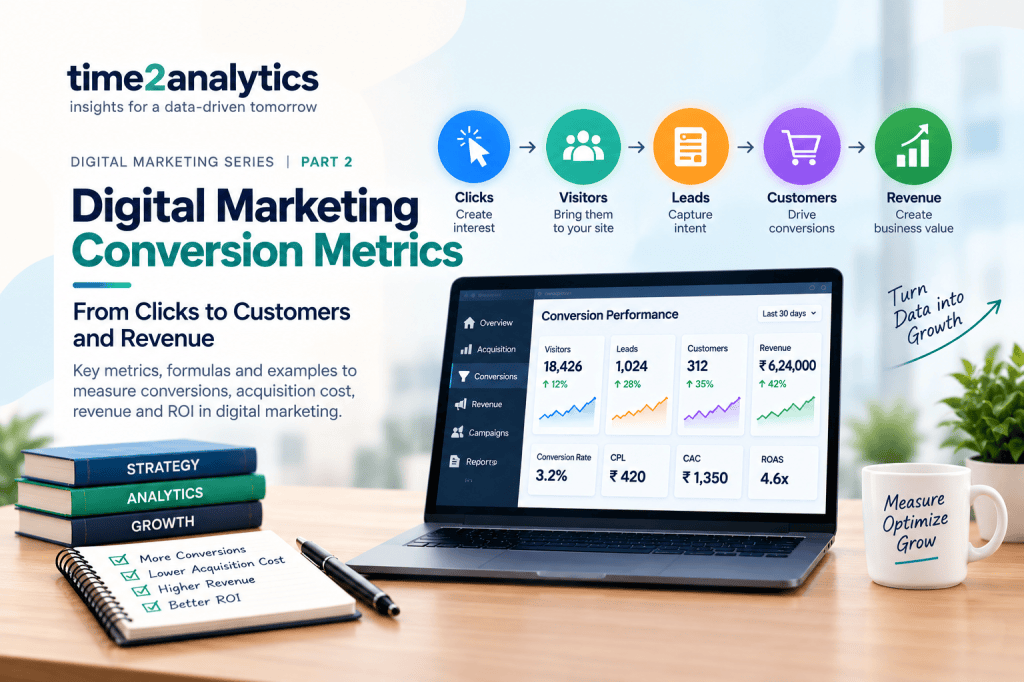
This article examines the metrics used to measure the movement from traffic to conversion and revenue.
1. What Is a Conversion?
A conversion occurs when a user completes a desired action.
Depending on the business, conversions may include:
- Purchase
- Lead submission
- Registration
- App installation
- Demo request
- Newsletter subscription
- Booking
- Download
- Enquiry
Therefore, conversion is not synonymous with purchase.
2. Conversion Rate
Formula
Conversion Rate (%) = (Conversions ÷ Total Visitors) × 100
Example
A website receives:
- Visitors = 20,000
- Conversions = 600
Therefore:
Conversion Rate = (600 ÷ 20,000) × 100
Conversion Rate = 3%
The website has a 3% conversion rate based on this definition.
3. Cost Per Lead (CPL)
CPL is particularly important for businesses where the primary objective is lead generation.
Formula
CPL = Marketing Cost ÷ Number of Leads
Example
Marketing expenditure = ₹2,00,000
Leads generated = 500
CPL = ₹2,00,000 ÷ 500
CPL = ₹400
The organization spends an average of ₹400 to generate one lead.
4. Cost Per Acquisition (CPA)
CPA measures the cost of generating a specified acquisition or conversion.
Formula
CPA = Campaign Cost ÷ Number of Acquisitions
Example
Campaign cost = ₹1,50,000
Customers acquired = 300
CPA = ₹1,50,000 ÷ 300
CPA = ₹500
The average acquisition cost is ₹500.
5. Customer Acquisition Cost (CAC)
CAC focuses specifically on the cost of acquiring new customers.
Formula
CAC = Total Sales and Marketing Cost ÷ Number of New Customers
Example
Suppose a company spends:
- Advertising = ₹4,00,000
- Marketing software = ₹50,000
- Sales and marketing personnel allocation = ₹1,50,000
Total cost = ₹6,00,000
New customers = 600
CAC = ₹6,00,000 ÷ 600
CAC = ₹1,000
The average customer acquisition cost is ₹1,000.
6. Lead-to-Customer Conversion Rate
A lead is not necessarily a customer.
Therefore, organizations should measure how many leads eventually become customers.
Formula
Lead-to-Customer Rate (%) = (Customers ÷ Leads) × 100
Example
Leads = 1,000
Customers = 100
Lead-to-Customer Rate = (100 ÷ 1,000) × 100
Lead-to-Customer Rate = 10%
This metric provides insight into lead quality and sales effectiveness.
7. Average Order Value (AOV)
AOV measures the average amount spent per order.
Formula
AOV = Total Revenue ÷ Number of Orders
Example
Revenue = ₹10,00,000
Orders = 4,000
AOV = ₹10,00,000 ÷ 4,000
AOV = ₹250
The average order value is ₹250.
8. Return on Advertising Spend (ROAS)
ROAS measures revenue generated relative to advertising expenditure.
Formula
ROAS = Attributed Revenue ÷ Advertising Cost
Example
Advertising expenditure = ₹2,00,000
Attributed revenue = ₹8,00,000
ROAS = ₹8,00,000 ÷ ₹2,00,000
ROAS = 4
This means the campaign generated ₹4 in attributed revenue for every ₹1 of advertising expenditure.
ROAS is a revenue-based measure and should not be confused with profit.
9. Return on Investment (ROI)
ROI considers the return relative to the investment.
Formula
ROI (%) = [(Return − Investment) ÷ Investment] × 100
Example
Investment = ₹2,00,000
Return = ₹3,00,000
ROI = [(₹3,00,000 − ₹2,00,000) ÷ ₹2,00,000] × 100
ROI = 50%
ROI and ROAS answer different questions.
ROAS: How much attributed revenue did advertising generate?
ROI: What return did the investment generate relative to its cost?
10. Ecommerce Funnel Metrics
An ecommerce journey can be represented as:
Product View → Add to Cart → Checkout → Purchase
Each stage can be measured.
Suppose:
| Stage | Users |
|---|---|
| Product Views | 50,000 |
| Add to Cart | 10,000 |
| Checkout | 7,000 |
| Purchases | 5,000 |
The organization can identify where users are dropping out.
11. Cart Abandonment Rate
Formula
Cart Abandonment Rate (%) = [(Carts − Purchases) ÷ Carts] × 100
Example
Carts created = 10,000
Purchases = 7,000
Cart Abandonment Rate = [(10,000 − 7,000) ÷ 10,000] × 100
Cart Abandonment Rate = 30%
This means 30% of carts did not result in completed purchases under this calculation.
12. Google Analytics 4 and Conversion Measurement
Google Analytics 4 uses events to measure user interactions.
Examples include:
add_to_cartbegin_checkoutgenerate_leadsign_uppurchase
Organizations can identify business-important events as key events in GA4.
The important principle is to design measurement around business objectives rather than simply collecting every available event.
13. Example: Complete Campaign Analysis
Consider an ecommerce campaign:
- Advertising cost = ₹1,00,000
- Impressions = 500,000
- Clicks = 20,000
- Website visitors = 18,000
- Leads = 1,000
- Customers = 200
- Revenue = ₹4,00,000
CTR
CTR = (20,000 ÷ 500,000) × 100 = 4%
CPC
CPC = ₹1,00,000 ÷ 20,000 = ₹5
Visitor-to-customer conversion rate
Conversion Rate = (200 ÷ 18,000) × 100 = 1.11%
CAC
CAC = ₹1,00,000 ÷ 200 = ₹500
ROAS
ROAS = ₹4,00,000 ÷ ₹1,00,000 = 4
This is much more informative than simply saying:
“The campaign generated 500,000 impressions.”
The metrics show the entire journey from exposure → click → visitor → customer → revenue.
14. Key Takeaways
| Metric | Formula |
|---|---|
| Conversion Rate | Conversions ÷ Visitors × 100 |
| CPL | Marketing Cost ÷ Leads |
| CPA | Campaign Cost ÷ Acquisitions |
| CAC | Sales & Marketing Cost ÷ New Customers |
| Lead-to-Customer Rate | Customers ÷ Leads × 100 |
| AOV | Revenue ÷ Orders |
| ROAS | Attributed Revenue ÷ Advertising Cost |
| ROI | (Return − Investment) ÷ Investment × 100 |
| Cart Abandonment | (Carts − Purchases) ÷ Carts × 100 |
The key lesson:
Traffic is an input. Conversion and revenue are outcomes.
But even revenue does not provide the complete picture.
A customer acquired today may purchase repeatedly over several years.
That takes us to the third article.
15. References
- Google Analytics Help — Events and key events.
- Google Ads Help — Advertising metrics.
- DataReportal — Digital 2026.
- Kotler, P., Keller, K. L. & Chernev, A. Marketing Management. Pearson.
- Chaffey, D. & Ellis-Chadwick, F. Digital Marketing: Strategy, Implementation and Practice. Pearson.








Leave a comment