
🌟 Introduction
In today’s data-driven world, predictive analytics plays a central role in decision-making — from forecasting sales to estimating crop yield, predicting house prices, or determining customer churn.
At the core of these predictive models lies one of the simplest yet most powerful statistical tools: Linear Regression.
🔍 What is Linear Regression?
Linear Regression is a statistical technique that models the relationship between a dependent variable (Y) and one or more independent variables (X) by fitting a straight line to the observed data.
In essence:
Linear Regression helps us understand how changes in X influence Y.
Example:
- Predicting sales (Y) based on advertising spend (X).
- Estimating crop yield (Y) based on rainfall (X).
- Forecasting employee productivity (Y) based on training hours (X).
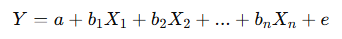
🧮 The Simple Linear Regression Equation

Where:
- Y = Dependent variable (the outcome we predict)
- X = Independent variable (predictor)
- a = Intercept (value of Y when X = 0)
- b = Slope (rate of change of Y for a one-unit increase in X)
- e = Error term (difference between actual and predicted values)
🧠 Interpretation:
If b=2, it means for every one-unit increase in X, Y increases by 2 units (on average).
🧩 Objective of Linear Regression
- To establish a relationship between variables.
- To predict the dependent variable based on known values of the independent variable.
- To quantify the effect of changes in predictors on the response variable.
📊 Example 1: Simple Linear Regression
Let’s model the relationship between Advertising Expenditure (X) and Sales Revenue (Y).
| Advertising (₹ ‘000) | Sales (₹ ‘000) |
|---|---|
| 10 | 25 |
| 20 | 45 |
| 30 | 65 |
| 40 | 70 |
| 50 | 95 |
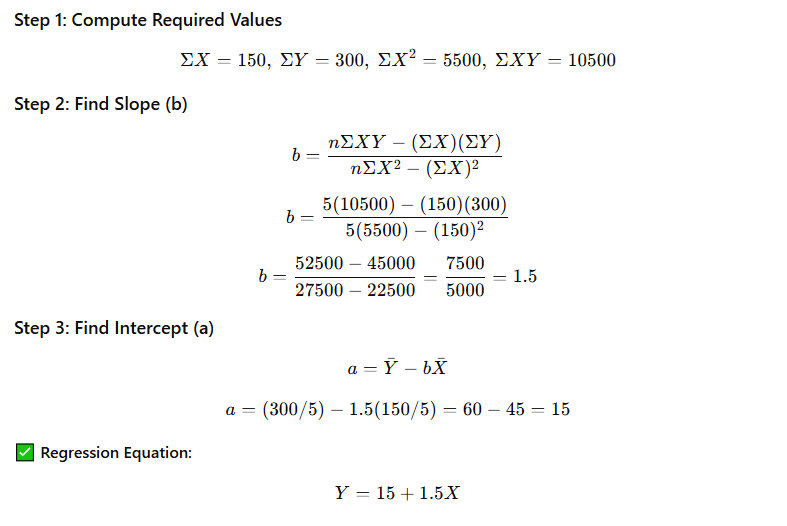
Step 4: Interpretation
- Intercept (a = 15): When no advertising is done (X = 0), the expected sales are ₹15,000.
- Slope (b = 1.5): For every ₹1,000 spent on advertising, sales increase by ₹1,500.
Step 5: Prediction
If advertising spend = ₹35,000 (X = 35):
Y= 15 + 1.5 (35) = 15 + 52.5 = 67.5
✅ Predicted Sales: ₹67,500
🧮 Example 2: Multiple Linear Regression
When two or more independent variables are used to predict Y, it’s called Multiple Linear Regression.
Example:
Predicting crop yield (Y) using rainfall (X₁) and fertilizer use (X₂).

Interpretation:
- Every additional mm of rainfall increases yield by 0.5 units.
- Every extra kg of fertilizer increases yield by 1.2 units.
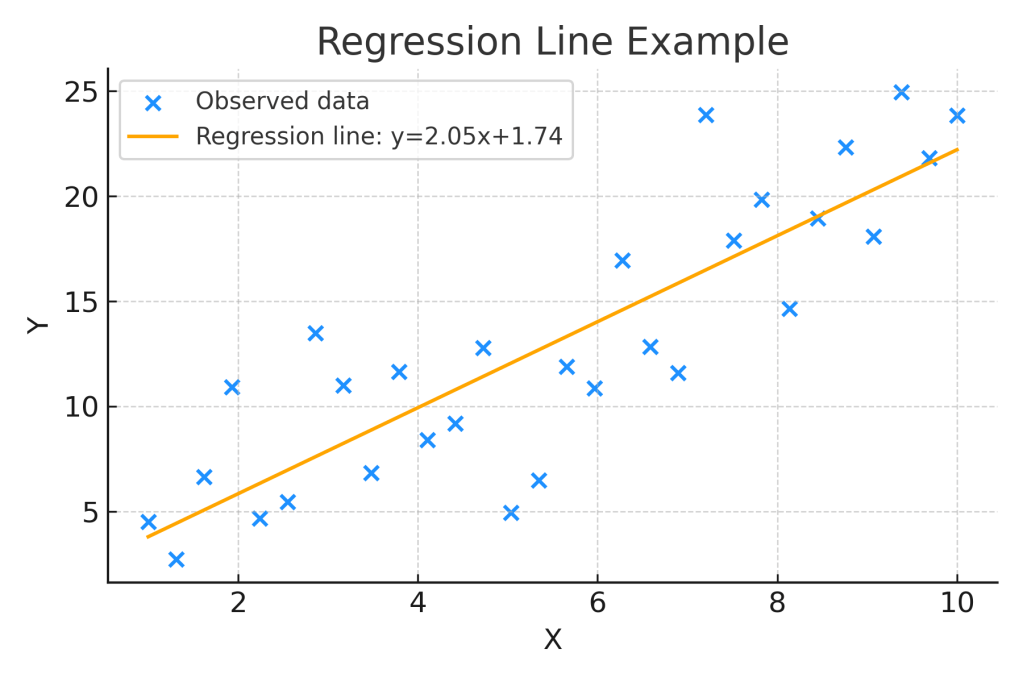
📈 Graphical Representation
Plot the data points and draw the regression line:
Y = a + b X
- The line passes as close as possible to all points (minimizing error).
- The slope shows the direction and strength of the relationship.
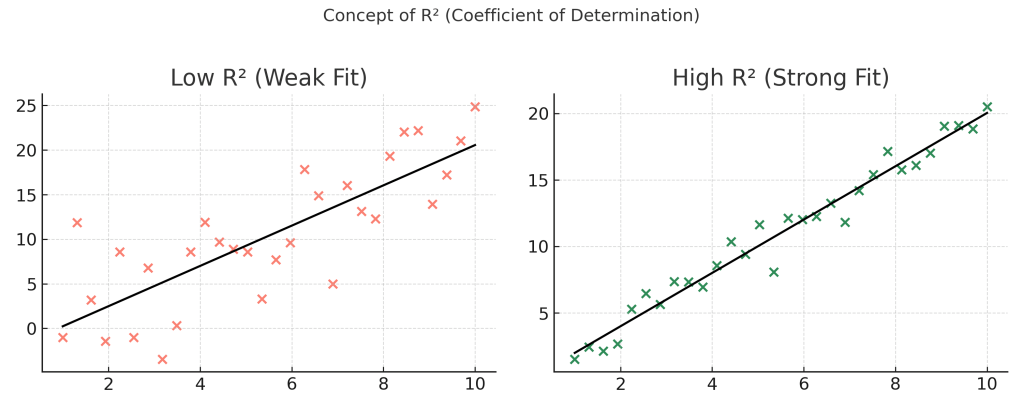
🔍 Measuring Goodness of Fit: R² (Coefficient of Determination)

Where:
- SSₜₒₜ = total variation in Y
- SSᵣₑₛ = unexplained variation (residuals)
Interpretation:
- R² = 1: Perfect fit
- R² = 0: No relationship
- R² = 0.85: 85% of variation in Y is explained by X
🧠 Assumptions of Linear Regression
- Linearity – The relationship between X and Y is linear.
- Independence – Observations are independent.
- Homoscedasticity – Equal variance of residuals.
- Normality – Residuals are normally distributed.
- No Multicollinearity – Independent variables aren’t highly correlated (in multiple regression).
⚙️ Steps to Perform Linear Regression (In Practice)
| Step | Description |
|---|---|
| 1 | Collect data for dependent and independent variables |
| 2 | Visualize using scatter plots |
| 3 | Compute regression equation parameters (a, b) |
| 4 | Check model fit using R² |
| 5 | Validate assumptions |
| 6 | Use model for prediction |
🧰 Tools: Excel, Python (scikit-learn, statsmodels), R, SPSS, SAS, Power BI
🧮 Example 3: Linear Regression in Python (Conceptual Snippet)
from sklearn.linear_model import LinearRegression
import numpy as np

# Data
X = np.array([[10], [20], [30], [40], [50]])
Y = np.array([25, 45, 65, 70, 95])

# Model
model = LinearRegression().fit(X, Y)

print("Intercept:", model.intercept_)
print("Slope:", model.coef_)
print("R^2 Score:", model.score(X, Y))
✅ Output:
Intercept: 15.0
Slope: 1.5
R^2 Score: 0.97
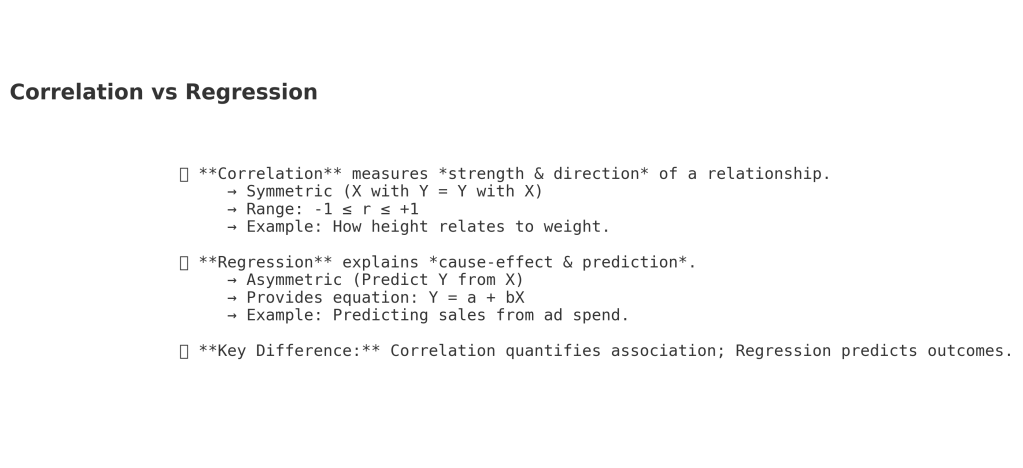
📘 Key Differences Between Correlation and Regression
| Feature | Correlation | Regression |
|---|---|---|
| Purpose | Measures strength of relationship | Predicts value of one variable using another |
| Direction | Symmetrical (X ↔ Y) | Asymmetrical (Y on X) |
| Output | Correlation coefficient (r) | Regression equation (Y = a + bX) |
| Use Case | Association analysis | Prediction and forecasting |
🌍 Real-World Applications of Linear Regression
| Sector | Application |
|---|---|
| Agriculture | Predicting crop yield from rainfall and fertilizer use |
| Finance | Forecasting stock returns |
| Marketing | Estimating sales from ad expenditure |
| Operations | Predicting machine downtime |
| Education | Analyzing student performance vs study hours |
🧾 Key Takeaways
- Linear Regression is the simplest yet most widely used predictive model.
- It quantifies the relationship between dependent and independent variables.
- The regression line is derived using the least squares method.
- Model accuracy is measured using R².
- Regression is a foundation for advanced techniques like Logistic Regression, Time Series Models, and Machine Learning Algorithms.
📚 Further Reading
- Draper & Smith (2014) – Applied Regression Analysis
- Montgomery, D.C. – Introduction to Linear Regression Analysis
- Khan Academy – Regression Basics
- Scikit-learn Regression Tutorial


Leave a comment